
How Can We Help?
Splashmetrics Datapoints : Overview
FOR MA/CRM TEAMS AND CONTENT CREATORS
This article covers areas of consideration for content creators in working with Splashmetrics datapoints. These datapoints are what drive the analytics in Splashmetrics, so it’s critical to get them right.
In that regard, there are two important things to think about. First, which interactions in the content should drive various datapoints. And, second, how and where do you assign them.
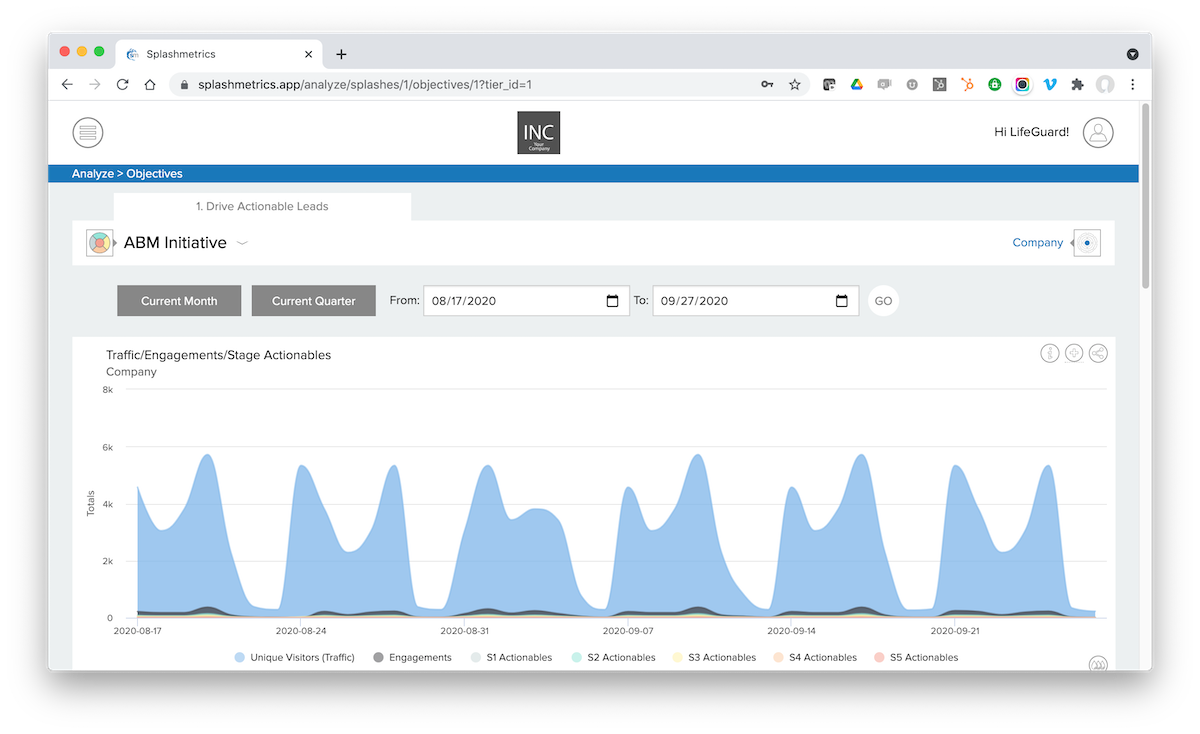
To get started, you should familiarize yourself with the standard Splashmetrics analytics and datapoints. You can do that by reviewing this article: What’s Measured and How.
In that article you’ll see that Splashmetrics gets data from several different sources such as Google Analytics, MA/CRM platforms, and most critically, the content itself. This last one is where you as a content creator come in. Here are the content-driven datapoints:
- Engagements
- This information comes directly from your smart content experiences. Though you have control over exactly how and when this data is reported, it typically measures any and all strategic interactions the Buyer has with the content (e.g. – survey inputs, link selections, feedback interactions, etc.). This way you can measure exactly what is working and what is not within the content to engage your Buyers.
- S? Actionables
- For each smart content experience in each stage, you define what an Actionable is (if any) within the Splash planner. This datapoint measures those as triggered by the Buyer while in the content. For example, if a Buyer provides feedback via an interactive survey, this data can be pushed into your MA/CRM platform. If that happens, then a marketing/sales team member needs to take some action based on that info. This can be an automated email nurture from the MA platform, or it can be a sales call with that Buyer-provided information in hand. Remember, this is a two-way sales conversation happening through this content – so these Actionables are critical.
- Nurtures, Progressions, Jumps
- In each of your content experiences, you can measure the Buyer’s interactions with your CTAs.
- Nurtures – This could be an action to “Print/Save” the asset and/or a link to a separate nurture asset in the same stage of the journey where the Buyer might not yet be ready to progress. Both indicate increased Buyer interest and engagement with the content. For example, the”Print/Save” action indicates the Buyer’s interest in studying the content further or, more importantly, sharing it with colleagues and spreading the reach of the initiative via word-of-mouth. This is exactly what you want for ABM.
- Progressions – This is the standard CTA for moving the Buyer into the smart content experience of the next stage.
- Jumps – This is a CTA that will allow the Buyer to move more quickly to the final stages of the Journey. For example, maybe you want to allow the Buyer to request a demo (the asset in S5) at any point in the Journey. If, for example, they click on that CTA in the S2 asset, this would be a Jump. As you can imagine, jumps are great for accelerating your pipeline, but need to be used judiciously so you are not pushing Buyers too quickly.
- In each of your content experiences, you can measure the Buyer’s interactions with your CTAs.
- Marketing/Sales Response
- These are critical datapoints to measure whether your Marketing and/or Sales teams are following up on the above actionables as promised in the Alignment section of the plan. These Response numbers should equal or exceed the Actionable numbers.
Datapoint Strategy
In looking through the above datapoints, and understanding how they show up in Splashmetrics, it’s fairly self-evident where these datapoints should be assigned. Again, what you’re measuring here are the Buyer’s interactions with the various strategic CTAs, widgets, etc. that you have built in the asset.
For example, the progression datapoint should always be assigned to – and fired by – the CTA that takes the Buyer to the next asset in the next stage of the Journey. But other datapoints need a bit more thought and planning.
For example, you see above that the Engagements datapoint typically measures any and all strategic interactions that Buyer has with the content. But that’s really up to you and your Splashmetrics client. If they want to be more selective about what constitutes an engagement – such as only actionable events – then you can make that happen by only applying the datapoint class (see below) to those particular items.
In the same vein, Actionables are another area that need thought. If you’re client is using Splashmetrics, you will have received a SplashLogic spec that tells what the actionable is – so that you can build the interactive element in the content to accomplish that goal. BUT, you may need to be very selective about exactly which action fires that datapoint.
So, make sure to think about the best approach to ensuring that the data you are pushing into Splashmetrics aligns with what your client needs to see to best measure the results of the initiative. This kind of flexibility is the beauty of Splashmetrics.
Assigning Datapoints
If you are using our SplashMaker product, most of this work has already been done for you. First, on the Platform Integration / Splashmetrics / Analytics page in SplashMaker, you’ll see breakdown of all the possible datapoints you can use (and as listed above)…
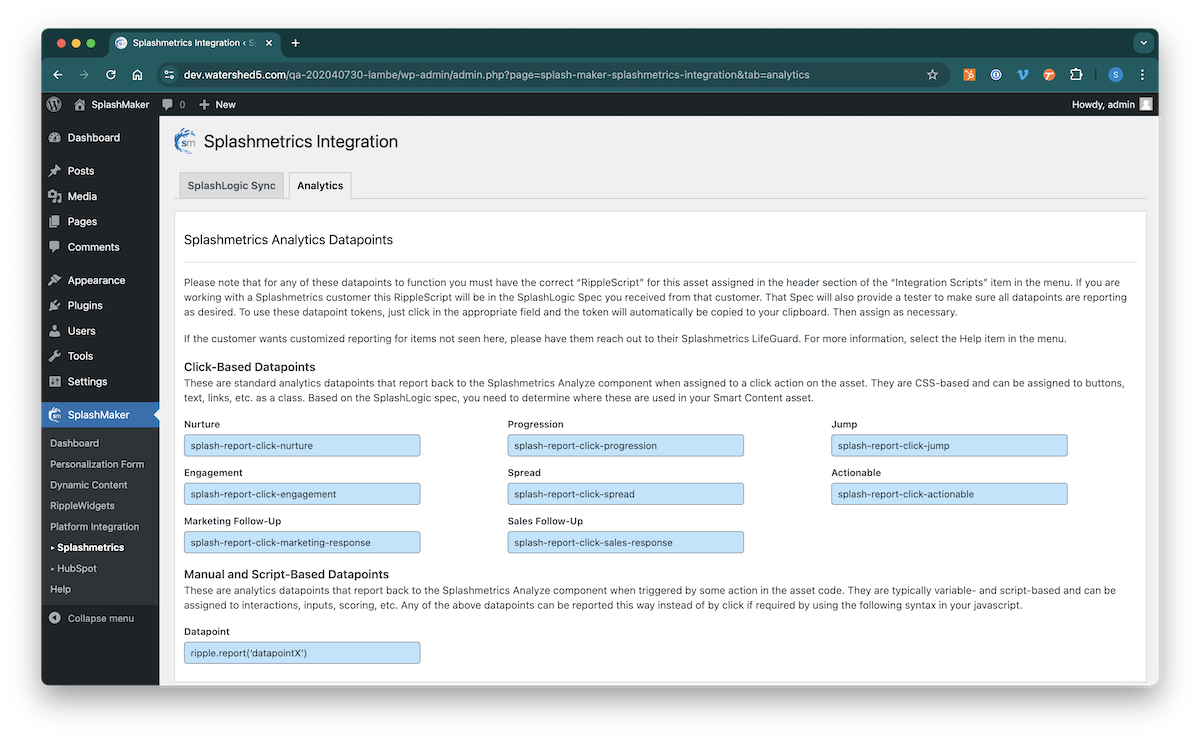
You’ll see on this page that there are two types of triggers for these:
Click-Based Datapoints: These datapoints are CSS-based and can be assigned to buttons, text, links, etc. as a class.
Script-Based Datapoints: These datapoints are typically variable- and script-based and can be assigned to interactions, inputs, scoring, etc. Any of the above datapoints can be reported this way instead of by click if required by using the shown syntax in your javascript.
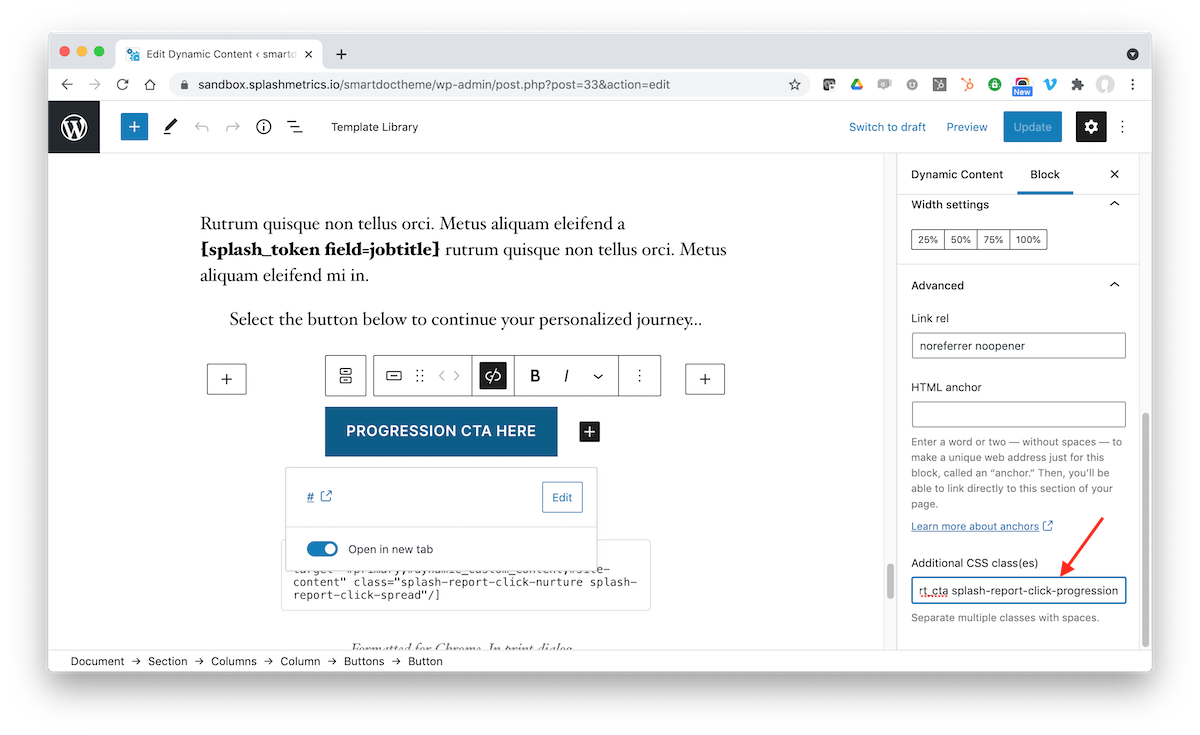
Now, if you’re using If you are using our SplashMaker product, look at the main CTA button in the Version dynamic content pages, you’ll see the Progression class already applied…
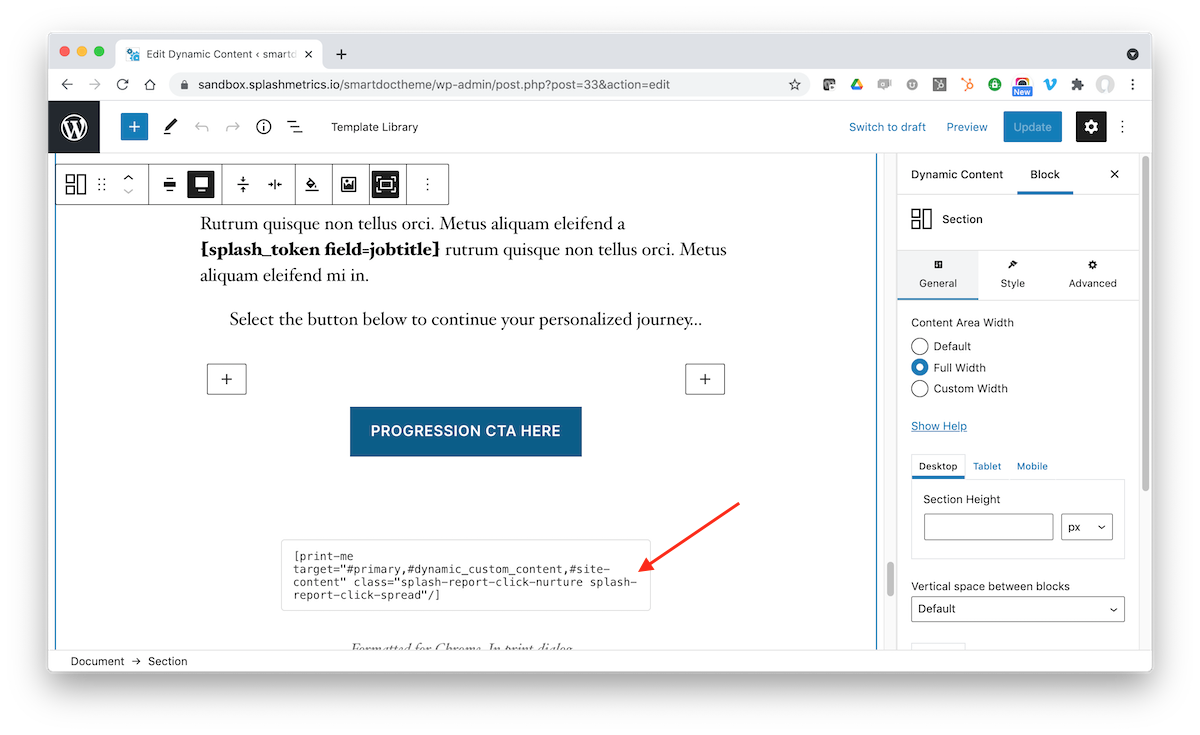
You’ll also see both Nurture and Spread classes assigned to the Print link…
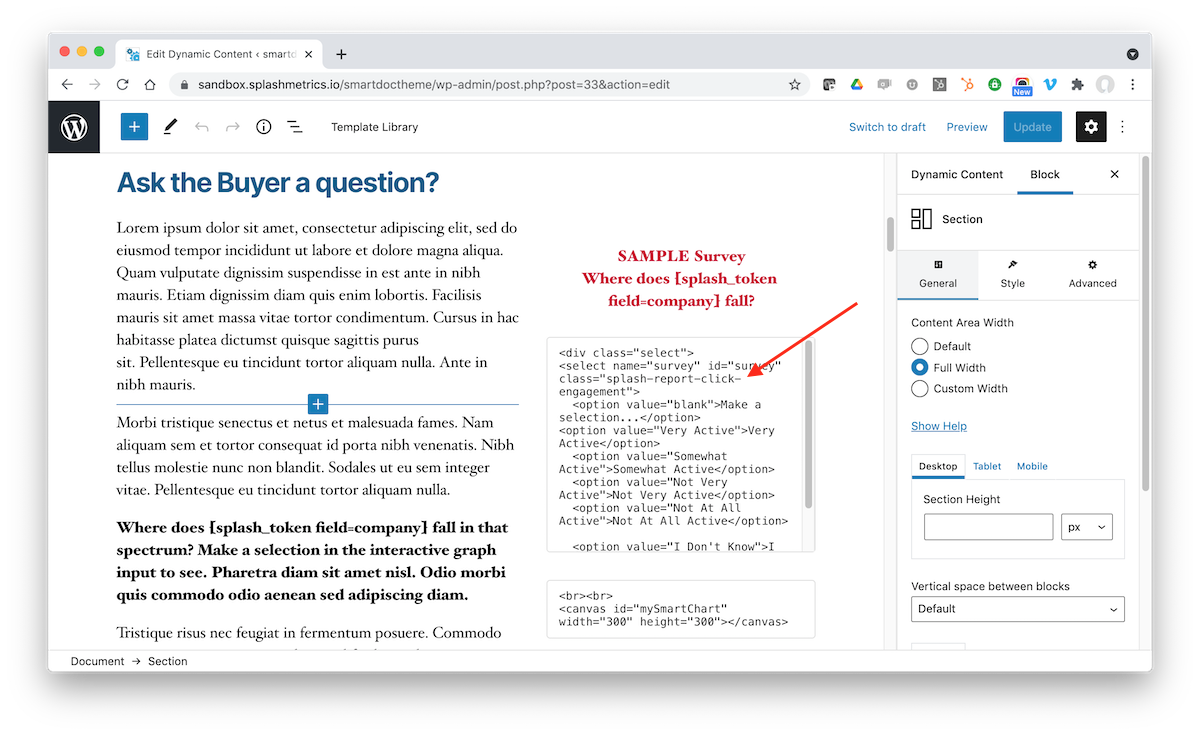
And finally, if you scroll to the top, you’ll see an Engagement class assigned to the SmartChart item pulldown…
You will also see the script-based datapoints in the RippleWidget code in our package as appropriate.
So with our SplashMaker product, there’s not much you need to do, unless you want different reporting as mentioned above in the Datapoint Strategy section. As long as you place the RippleScript code (see below) into your asset – the content will immediately start reporting these pre-coded datapoints back to Splashmetrics.
On the other hand, if you’re building your content in some other way, you can still use all these datapoint classes and code to accomplish the same connection with Splashmetrics. You’ll just need to manually assign these datapoints yourself based on the above logic.
The RippleScript
Regardless of whether you use our SplashMaker product or build your own content, you’ll need to ensure that both the Google Analytics and Splashmetrics RippleScript are placed into the head of your content asset.
Fortunately, Splashmetrics makes this very easy. This information is located in the SplashLogic specification you received from the client and will automatically once the Splash is launched by your client…
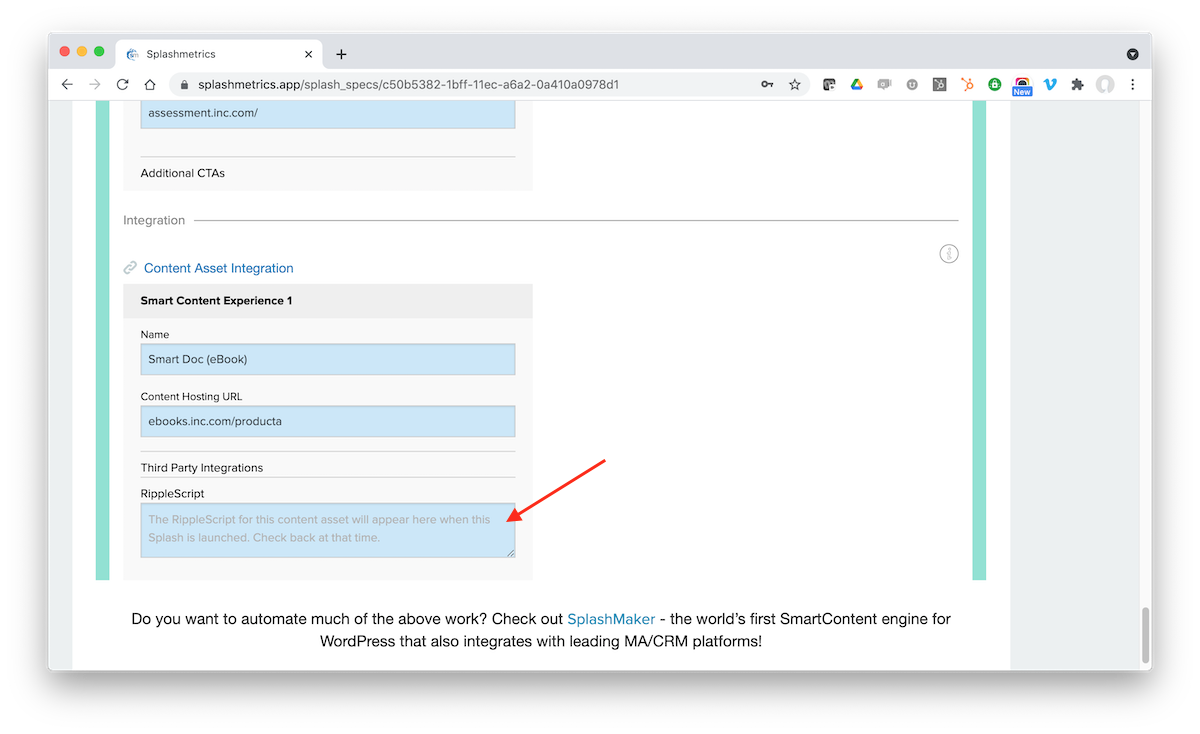
Just drop both the GA and RippleScript into the head of your content asset (this is automated in our SplashMaker product) – and the data should start flowing into the Analytics in Splashmetrics.
It’s that easy!