How Can We Help?
What’s Measured and How
What’s in these Drops?
Splashmetrics aims to provide 360°, CMO-level “executive summary” reporting across your entire initiative. This means that the multi-platform data coming into your Drops is comprehensive and focused on knowing one thing: Are you successfully engaging and moving the required number of Buyers through your journey to reach your established revenue target?
The Drops include data and breakdowns from the following sources:
- Web Analytics
- Google Analytics tied to your account.
- BJF (Buyer Journey Flow) Content
- Buyer-specific data from the smart content itself (where the Buyer conversation happens).
- MA/CRM
- Data that is going into and coming out of your integrated MA/CRM platforms.
If you need more granularity in these various metrics, you can find that in each of the separate platforms. As mentioned above, Splashmetrics Analyze is not focused on such granularity, but on letting you see very quickly whether or not your Splash is doing what it needs to do – and exactly where challenges might lie.
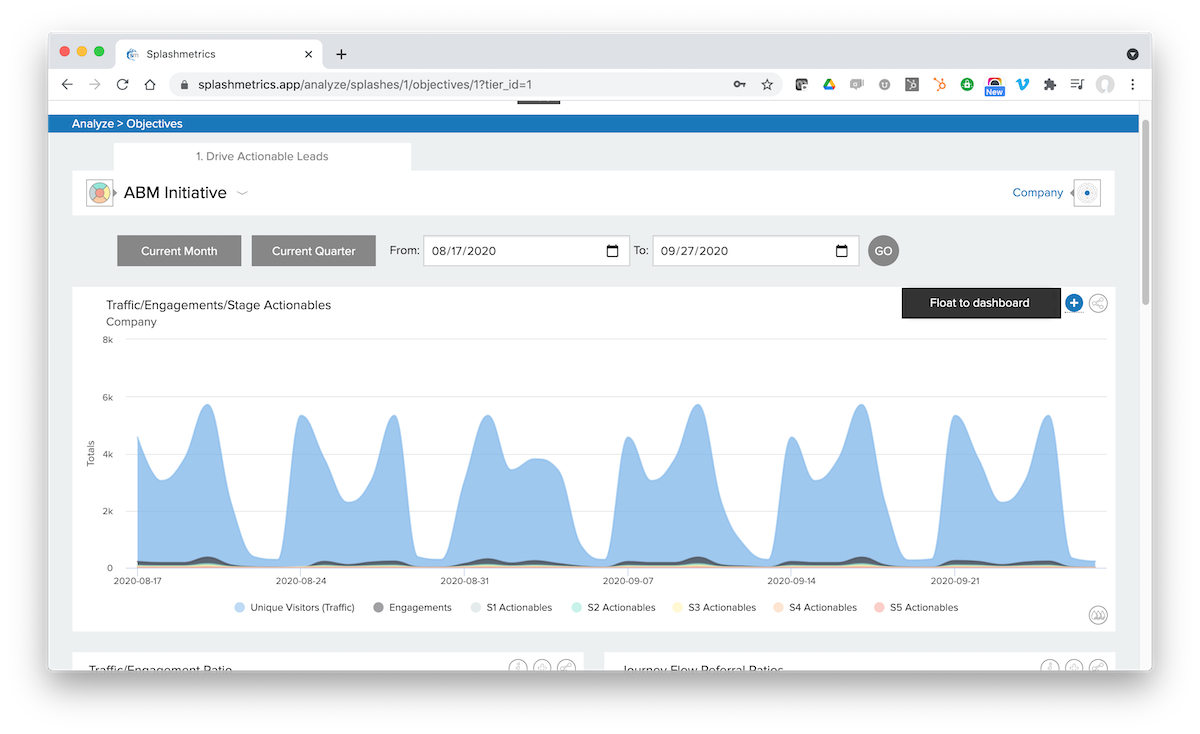
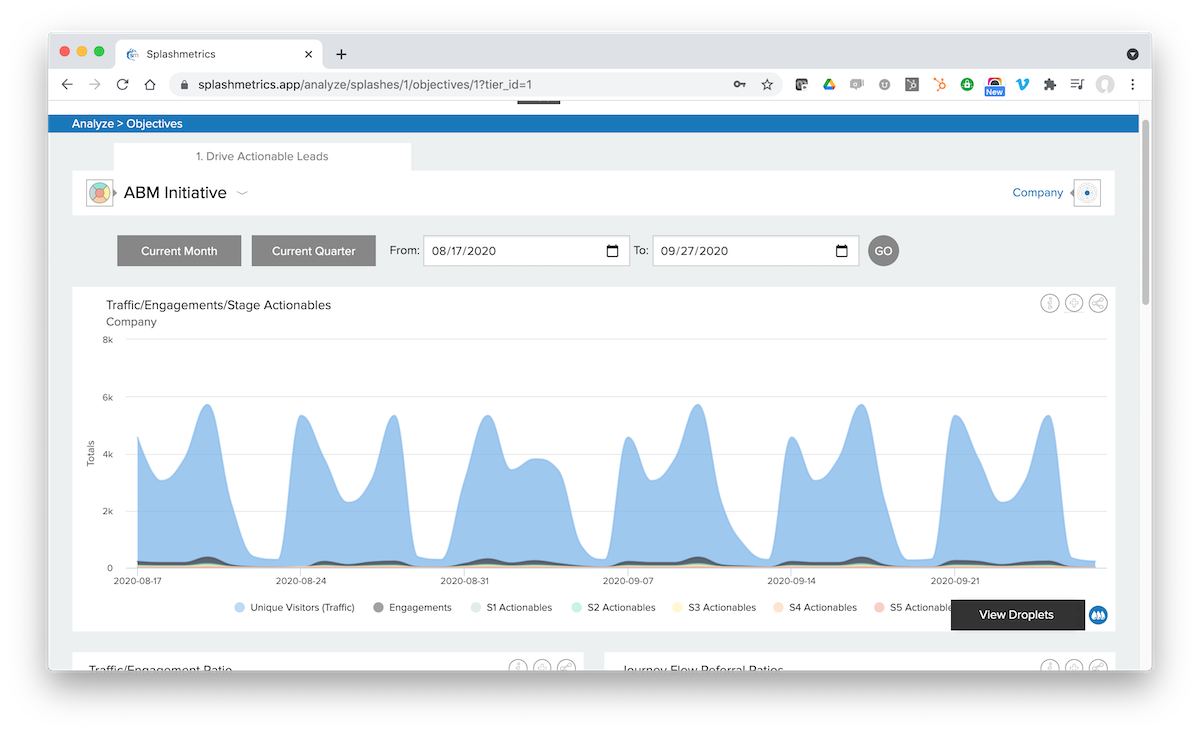
So, looking at the image above, you’ll see several datapoints in the bottom legend of the Drop. Let’s break these down:
- Unique Visitors (Traffic)
- This information comes from Google Analytics. It represents all the Unique Visitors to each content asset in every stage of the journey.
- Engagements
- This information comes directly from your smart content experiences. Though you have control over exactly how and when this data is reported, it typically measures any and all strategic interactions the Buyer has with the content (e.g. – survey inputs, link selections, feedback interactions, etc.). This way you can measure exactly what is working and what is not within the content to engage your Buyers.
- S? Actionables
- For each smart content experience in each stage, you define what an Actionable is (if any) within the Splash planner. This datapoint measures those as triggered by the Buyer while in the content. For example, if a Buyer provides feedback via an interactive survey, this data can be pushed into your MA/CRM platform. If that happens, then a marketing/sales team member needs to take some action based on that info. This can be an automated email nurture from the MA platform, or it can be a sales call with that Buyer-provided information in hand. Remember, this is a two-way sales conversation happening through this content – so these Actionables are critical.
- Journey Flow Referrals
- This information comes from Google Analytics, and breaks down the referring channels that are driving the above Traffic. This way you can see exactly which channels are working for you and your Buyers.
- Nurtures, Progressions, Jumps
- In each of your content experiences, you can measure the Buyer’s interactions with your CTAs.
- Nurtures – This could be an action to “Print/Save” the asset and/or a link to a separate nurture asset in the same stage of the journey where the Buyer might not yet be ready to progress. Both indicate increased Buyer interest and engagement with the content. For example, the”Print/Save” action indicates the Buyer’s interest in studying the content further or, more importantly, sharing it with colleagues and spreading the reach of the initiative via word-of-mouth. This is exactly what you want for ABM.
- Progressions – This is the standard CTA for moving the Buyer into the smart content experience of the next stage.
- Jumps – This is a CTA that will allow the Buyer to move more quickly to the final stages of the Journey. For example, maybe you want to allow the Buyer to request a demo (the asset in S5) at any point in the Journey. If, for example, they click on that CTA in the S2 asset, this would be a Jump. As you can imagine, jumps are great for accelerating your pipeline, but need to be used judiciously so you are not pushing Buyers too quickly.
- In each of your content experiences, you can measure the Buyer’s interactions with your CTAs.
- Marketing/Sales Response
- These are critical datapoints to measure whether your Marketing and/or Sales teams are following up on the above actionables as promised in the Alignment section of the plan. These Response numbers should equal or exceed the Actionable numbers.
What all can I do with these Drops?
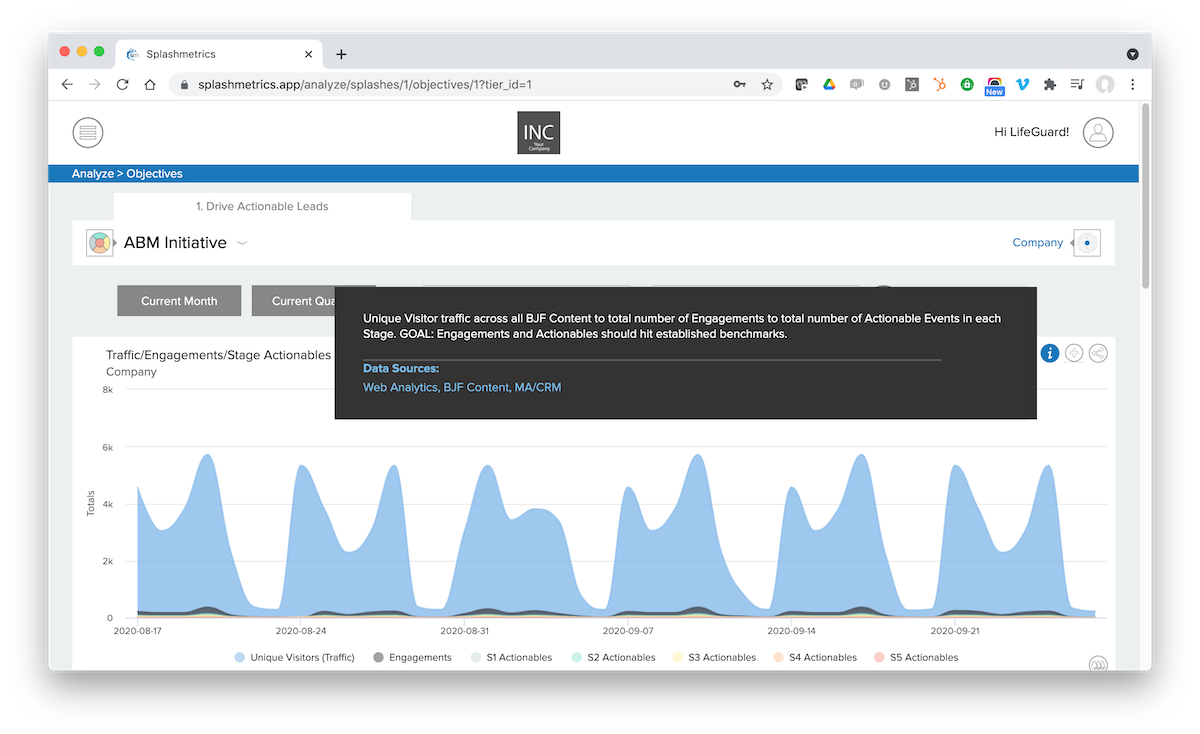
Every Drop in Splashmetrics has several valuable features. First there is an info pop-up to explain what is being measured, what the goal of the measurement is, and which platforms and content assets are providing the data.
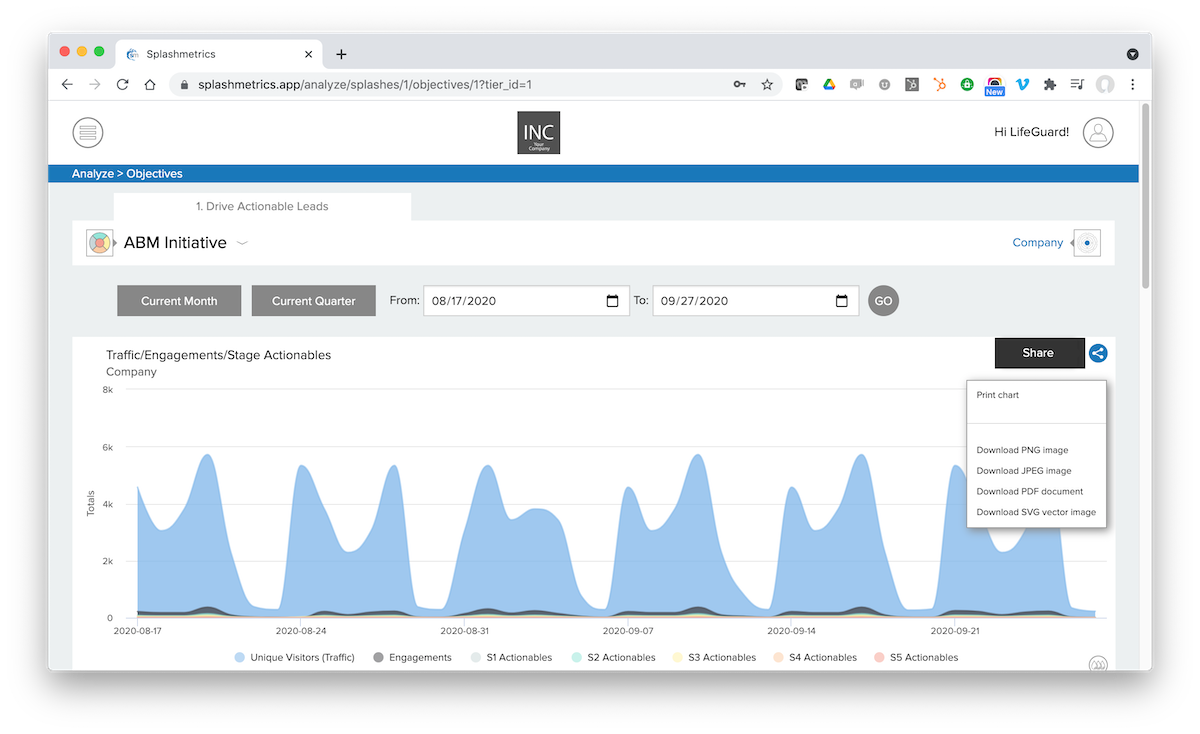
There is also a share button that allows you to print or export the Drop in various formats for such uses as reports or presentations.
There is also a revolutionary feature called “View Droplets”. This feature takes whatever data you are looking at in the Drop and breaks it down across your downstream Tiers, such as your company’s Divisions and/or Departments. This feature provides immediate company-wide performance comparisons that bring incredible value into your Buyer Journey analysis.
When activated, you see the results for the Tier(s) directly below your own – in this case The Departments below “Division 1″…
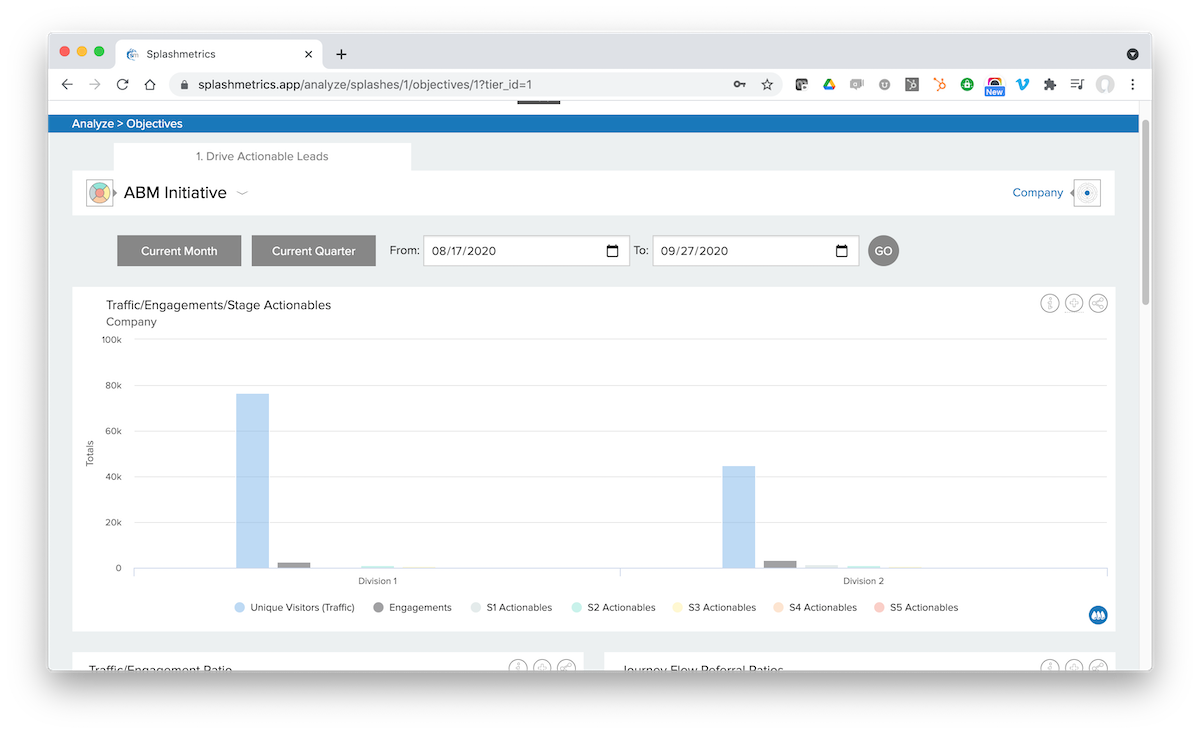
And you can continue to drill down all the way to the asset level in each stage.
The last Drop feature is the “Float to Dashboard” button. Clicking on this will send specific Drops to your personal dashboard so you can assemble a custom view of those areas you want to closely monitor on a daily basis. When you click this button, you’ll see that the icon changes from a plus sign, to a minus sign. This indicates that you have successfully floated the Drop to your dashboard.