
How Can We Help?
RippleWidget : SmartChart
CONTENT CREATOR
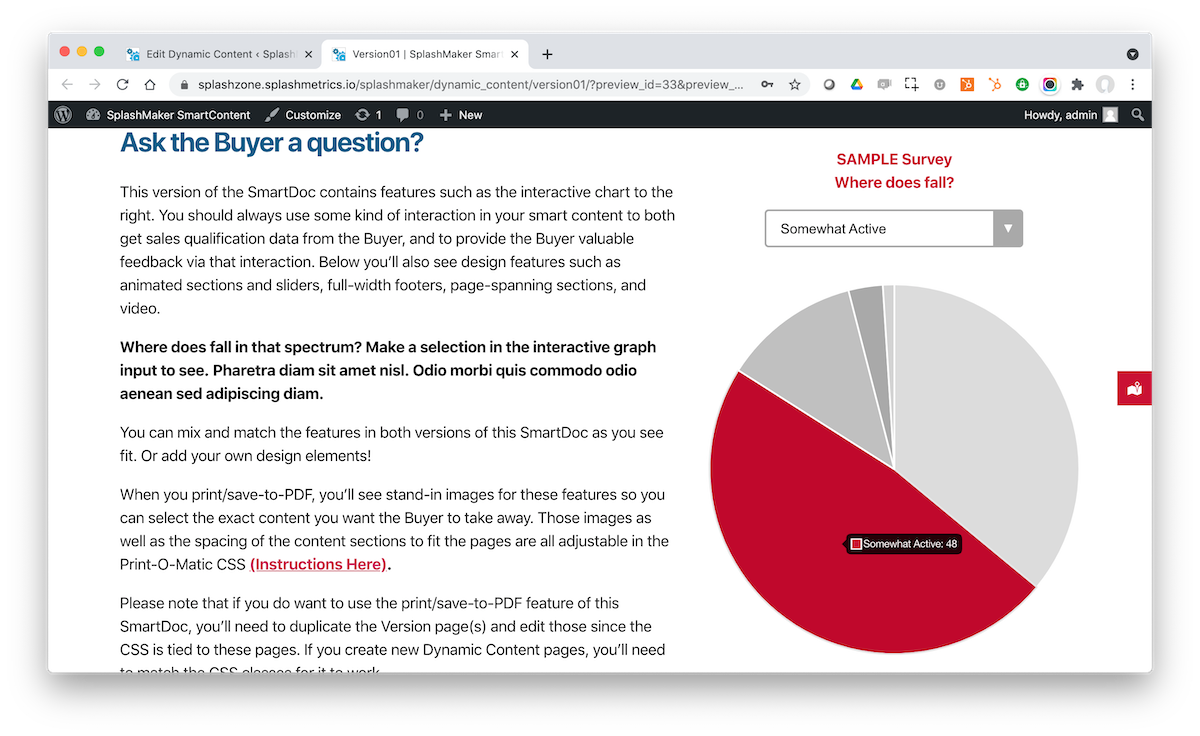
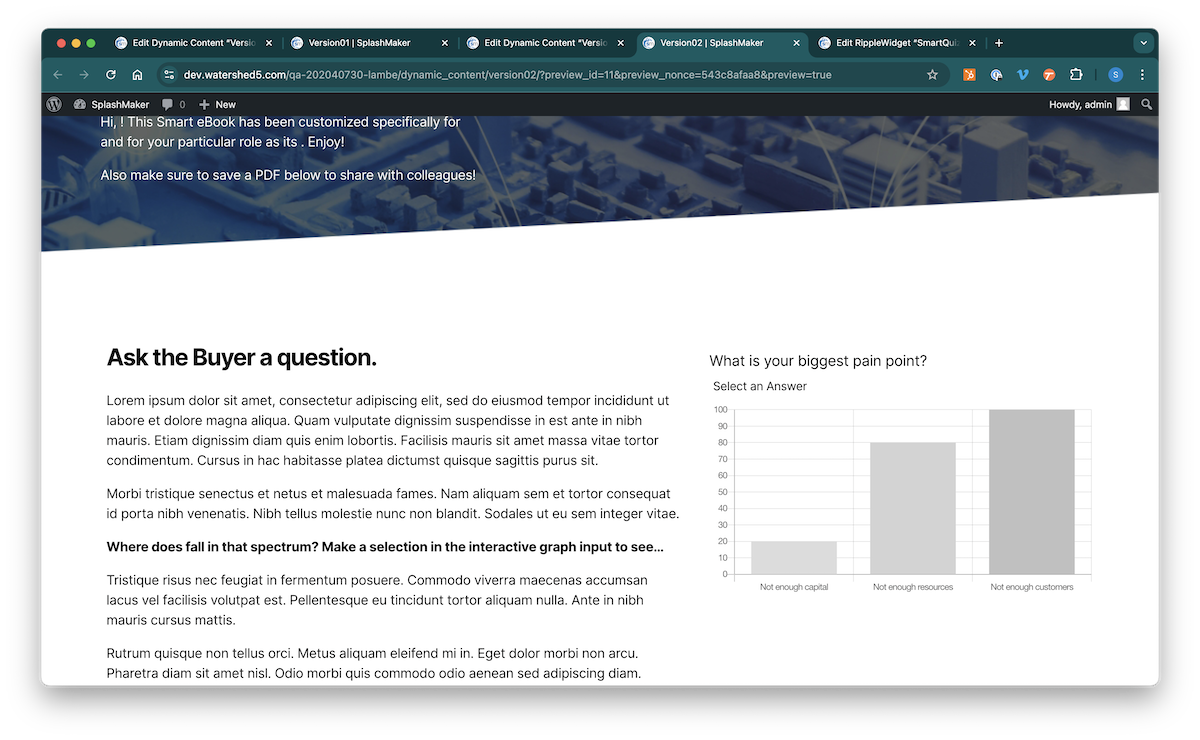
The RippleWidget SmartChart is an animated, interactive, and customizable HTML5 chart that responds to the Buyer’s input.
You’ll notice that we have already included this SmartChart widget code on the Version01 Dynamic Content page. So you can immediately start customizing that chart as outlined below.
However, for consistency, let’s begin with the RippleWidget Dynamic Content page since that will be where you typically start the process of customizing these widgets for use in your content.
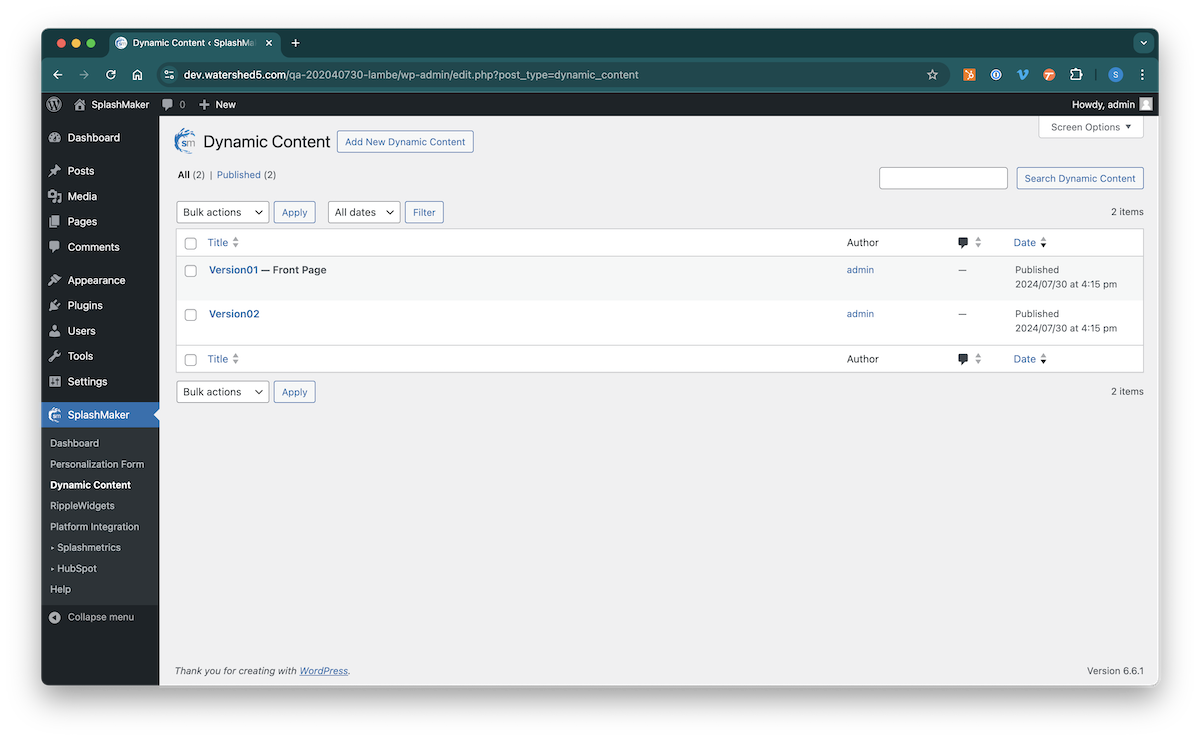
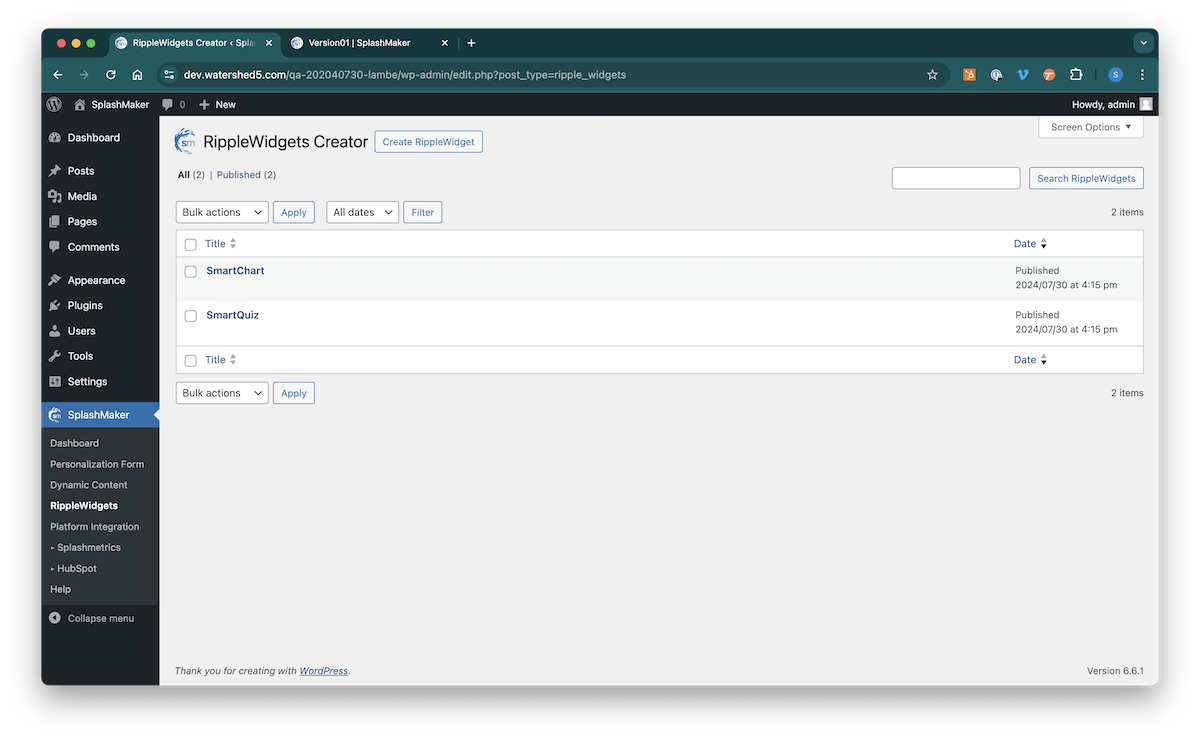
You’ll notice that this page is not published so that it won’t show up in your Personalization Form dropdown. It is here only to provide you the RippleWidget front-end code. When you enter the page you’ll see the widgets listed along with explanations of the code blocks and how to use them.
To customize the SmartChart, you will need to adjust the code in the following places…
Frontend Code
Input Dropdown
The is the dropdown code with the various options you’ll want to provide the Buyer. Let’s take a look below…
<div class="select">
<select name="survey" id="survey" class="splash-report-click-engagement">
  <option value="blank">Make a selection...</option>
<option value="Very Active">Very Active</option>
  <option value="Somewhat Active">Somewhat Active</option>
  <option value="Not Very Active">Not Very Active</option>
  <option value="Not At All Active">Not At All Active</option>
  <option value="I Don't Know">I Don't Know</option>
</select>
</div>
To change what’s visible to the Buyer in the dropdown, simply edit the label text between the carets (e.g. – …>Very Active</option>).
You can then also edit the values in the quotation marks (e.g. – value=”Very Active”) – to either match the label or be something else. For example, if you are using the SplashMaker+MA/CRM package, the values are what will be passed through to your MA/CRM platform when selected. They don’t have to match the labels. How you use them is up to you.
As mentioned on the page, if you are using our SplashMaker+MA/CRM package, these items are pre-coded to be passed into your MA/CRM package. The only tweak you will need to make is determining where this data goes in your MA/CRM. See below for that information.
Don’t change that first “blank” value for the prompt text – but you can change the “Make a selection…” text to whatever you’d like for the dropdown prompt.
Chart
This block of code is just the canvas shortcode for the chart itself. The only change you can make here is the sizing of the chart…
<canvas id="mySmartChart" width="300" height="300"></canvas>The id is tied to the backend code that drives the chart. So to change the actual chart, you will need to do the following.
Backend Code
To edit the backend code you’ll need to go to the Plugins/Plugin Editor page in the WP Menu. Then select the SplashMaker plugin…
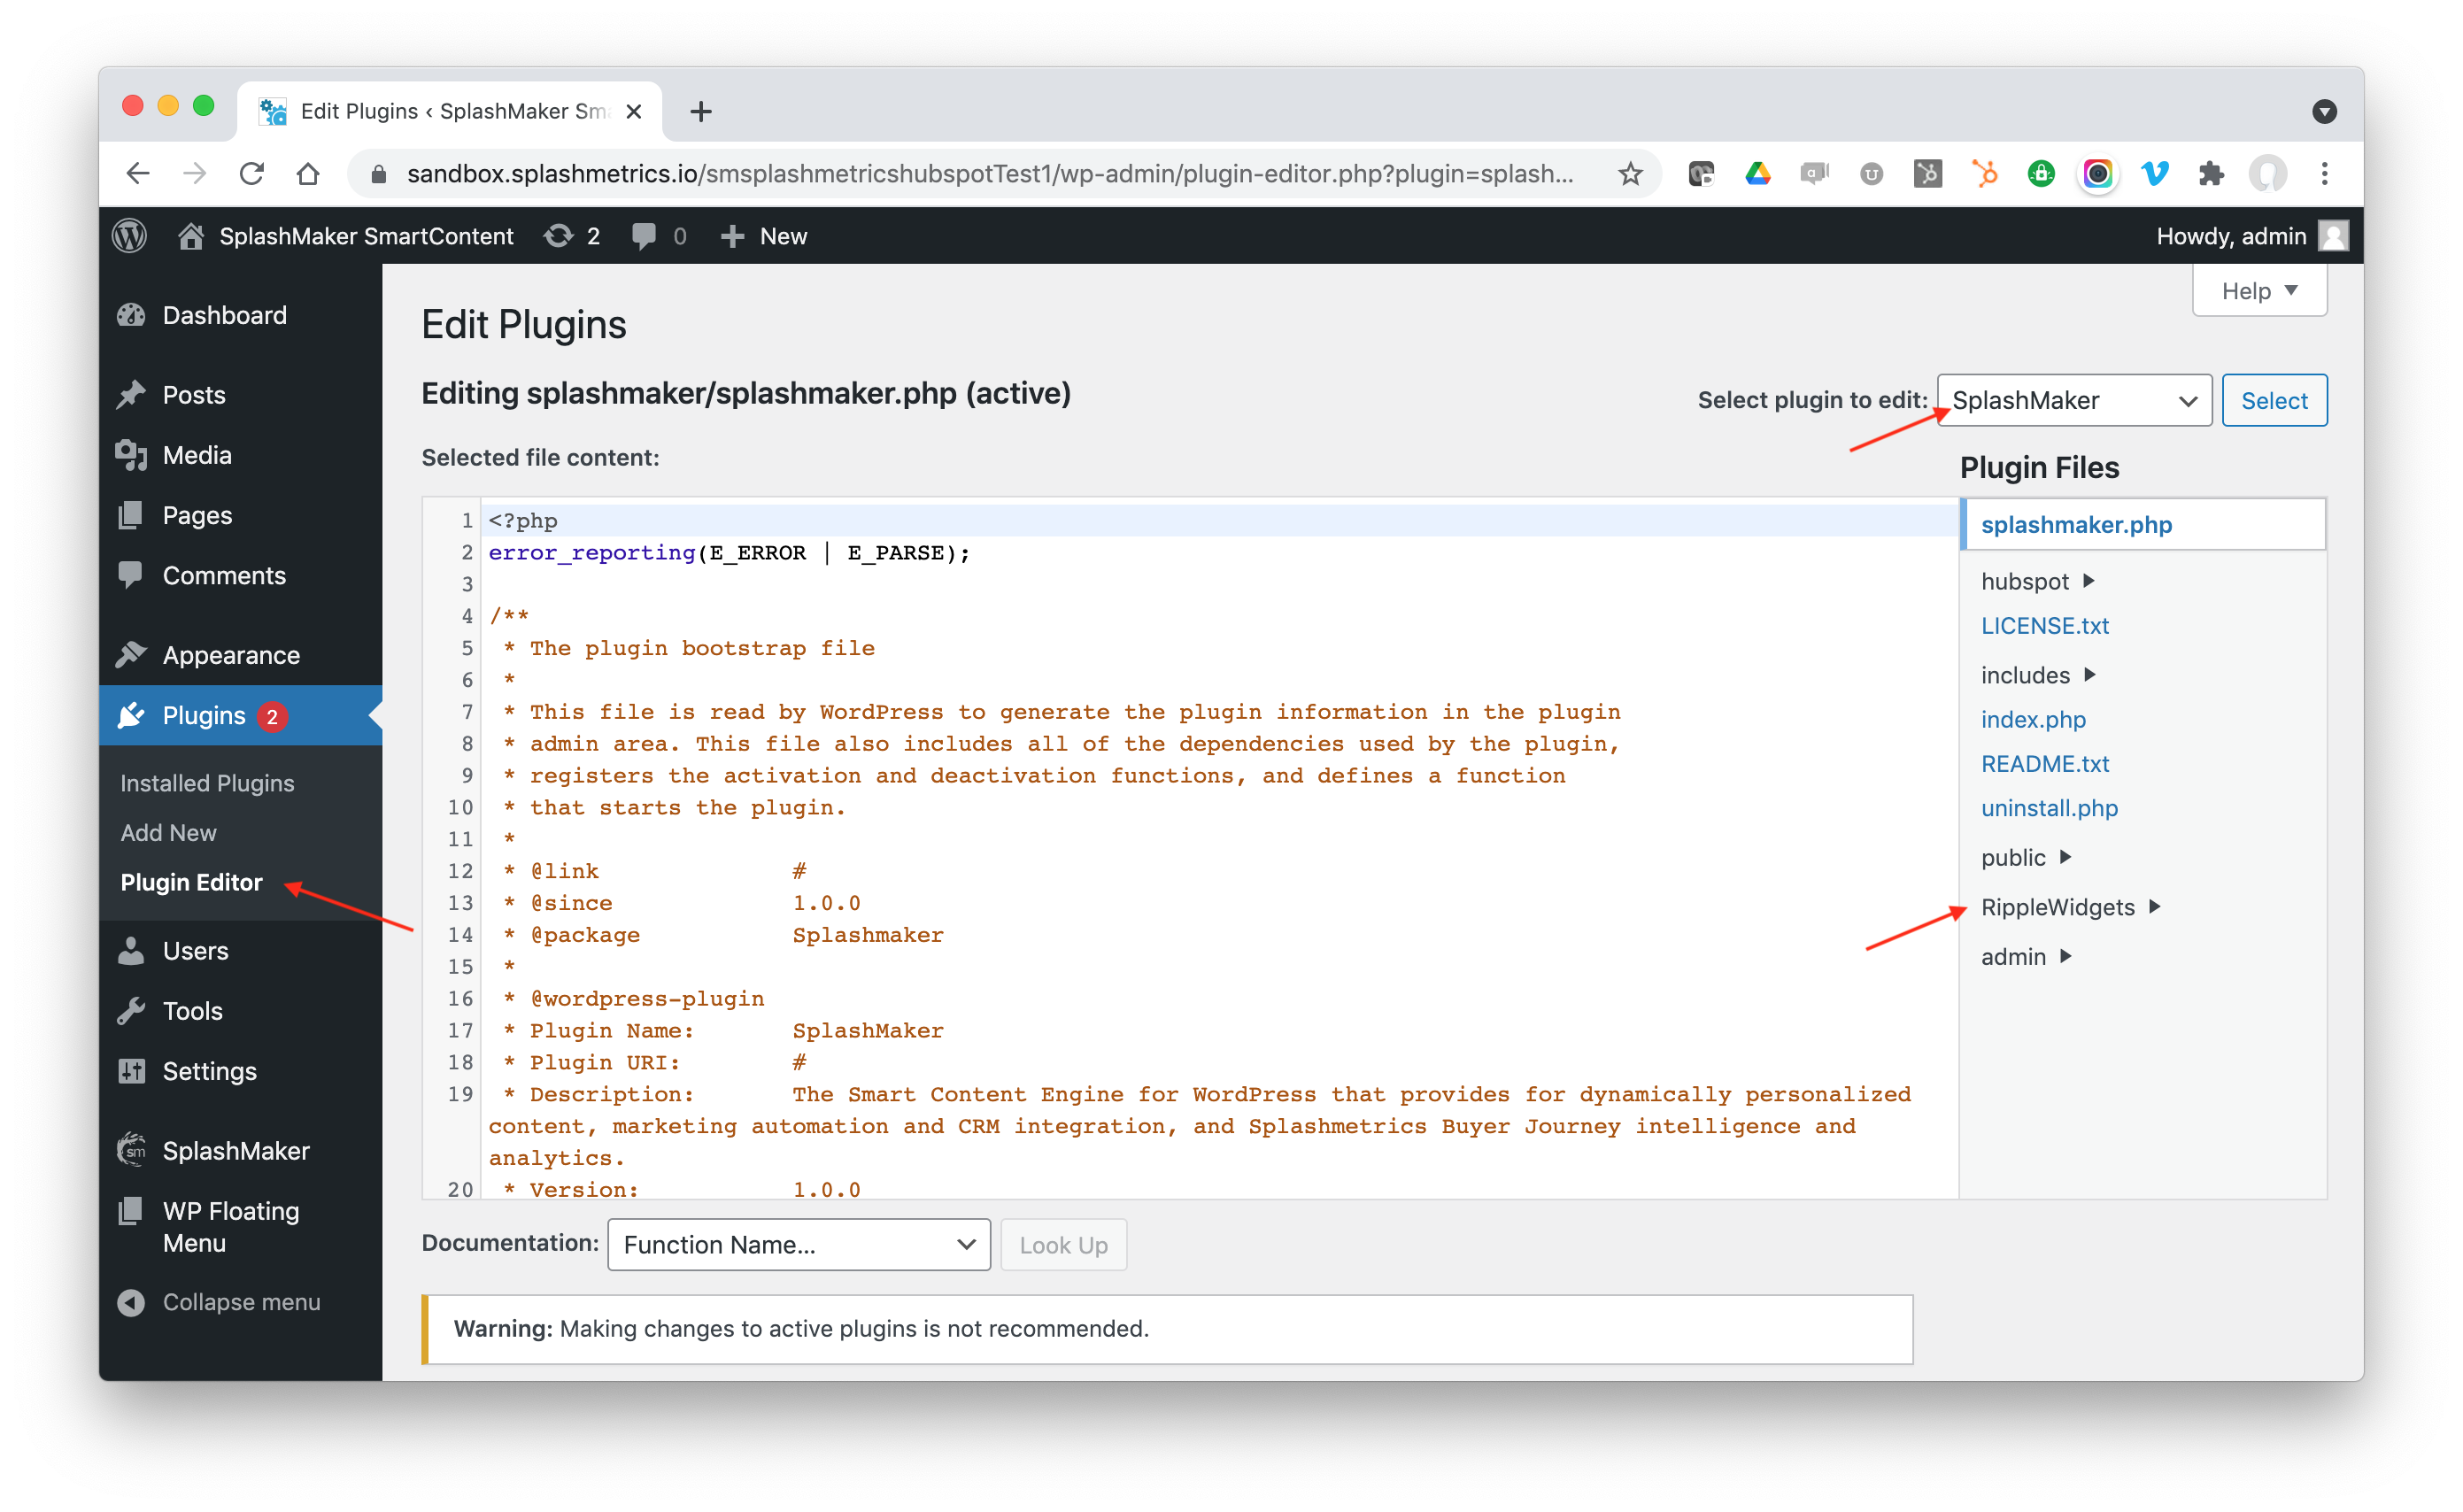
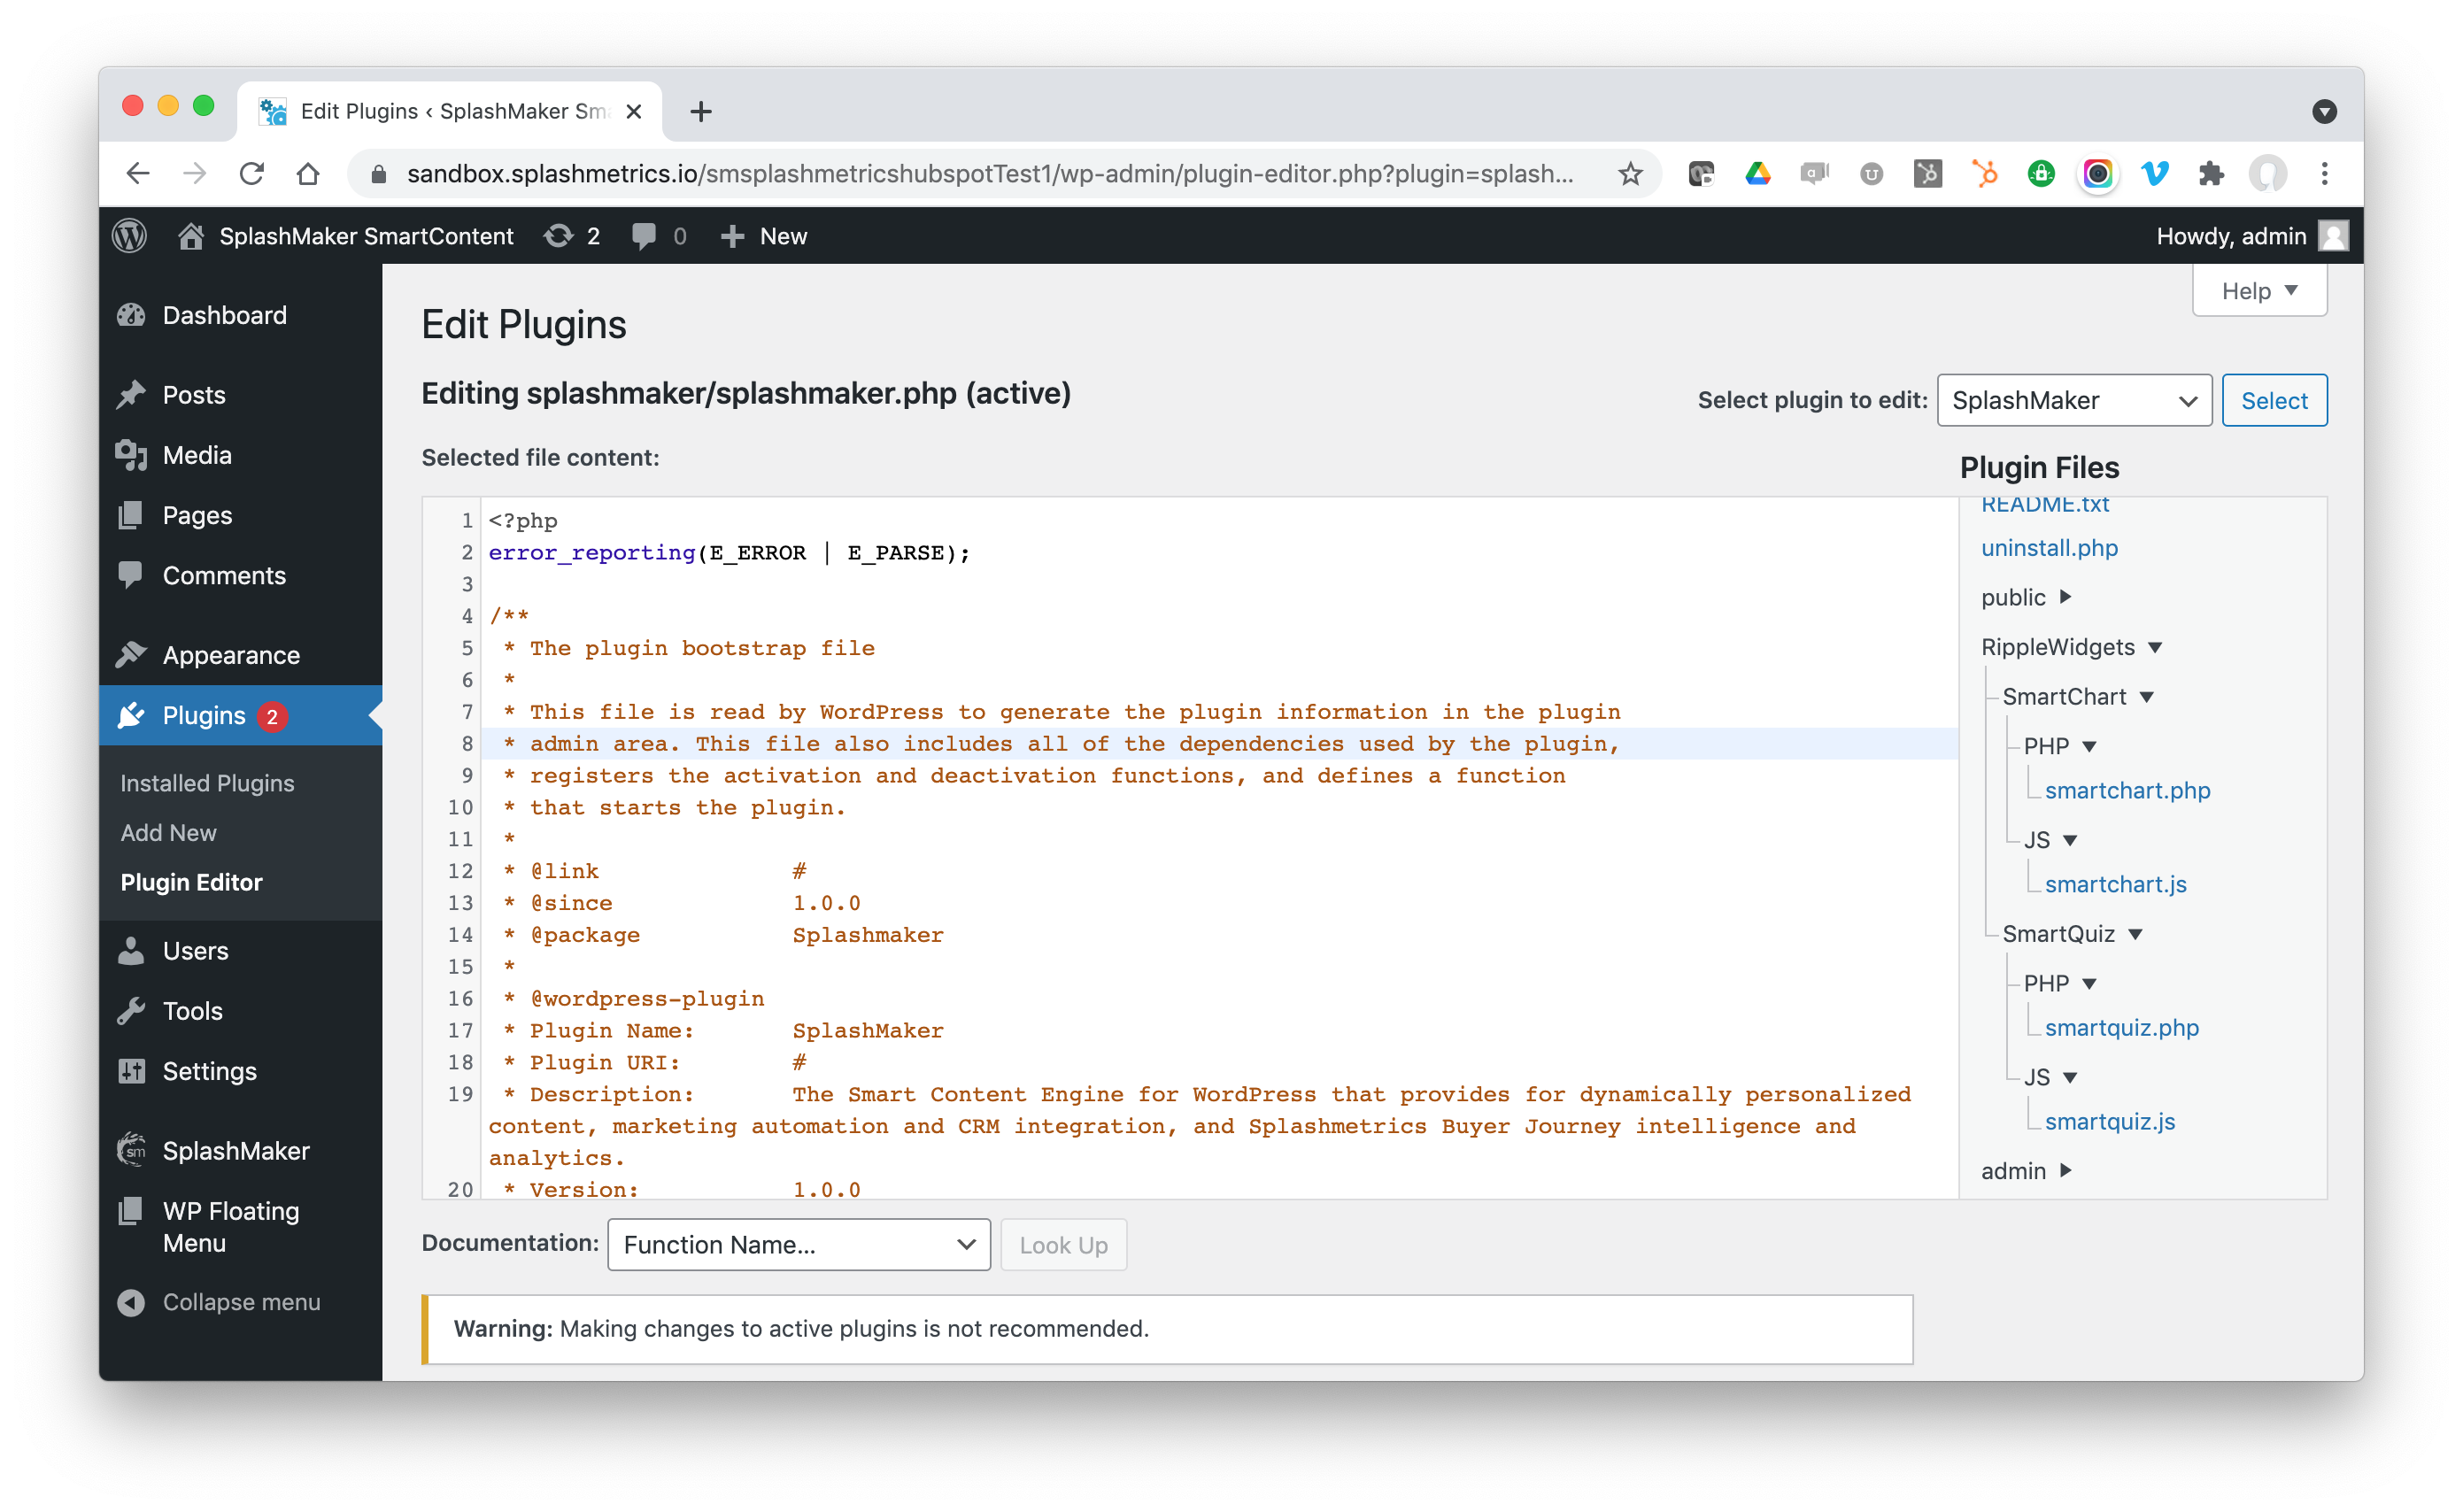
You’ll see the RippleWidgets component, under which you’ll find the backend php and js files that drive the widgets…
PHP Code
Let’s take a look at the smartchart.php file…
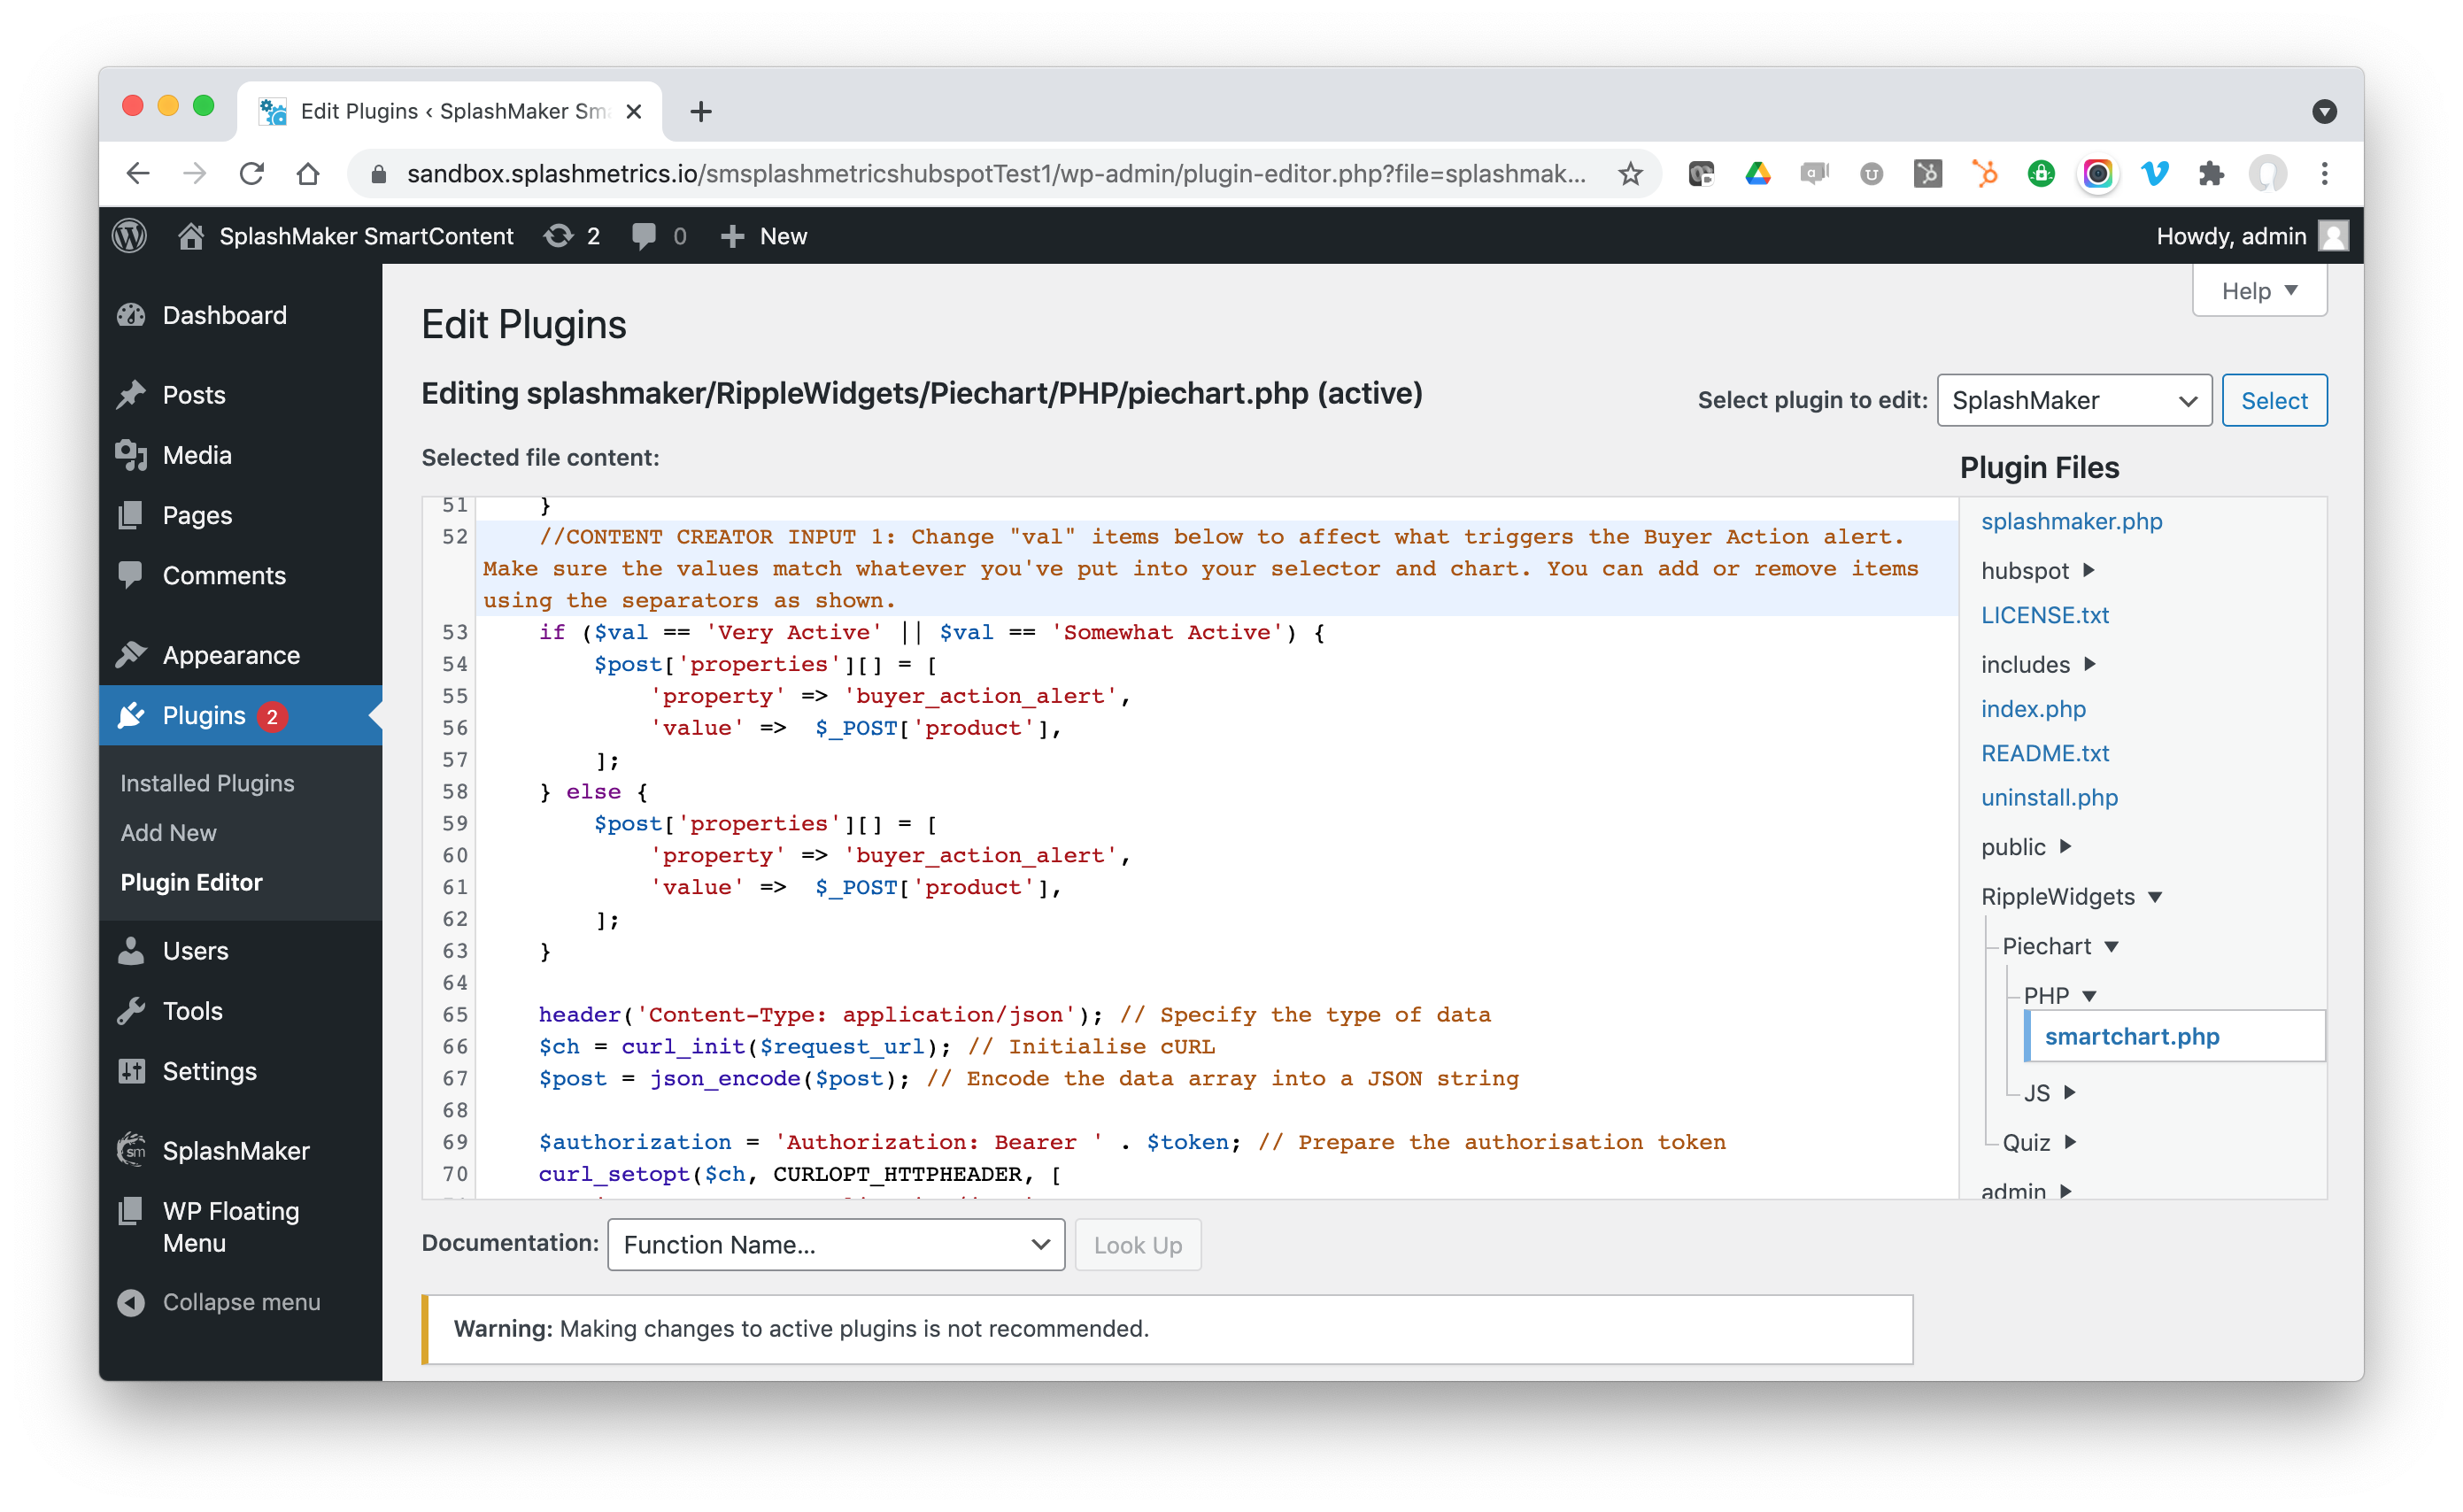
You’ll see comments in the code (“CONTENT CREATOR INPUT…”) that tell you want you need to change to affect how the widget looks and how it works.
For example, the first notation tells you how to adjust which items in the dropdown will fire off a “Buyer Action Alert” in your MA/CRM package (when using SplashMaker+MA/CRM). This way if certain items show a higher sales qualification than others, you can easily alert the sales team within the MA/CRM platform by leveraging this data.
So make sure that when you change what’s in the front-end dropdown, you come here and change these values as well.
The Buyer Data from this SmartChart is driven by the code above, but also the MA/CRM mapping of this SmartChart widget in the Platform Integration section of SplashMaker+. You can find out more about that here.
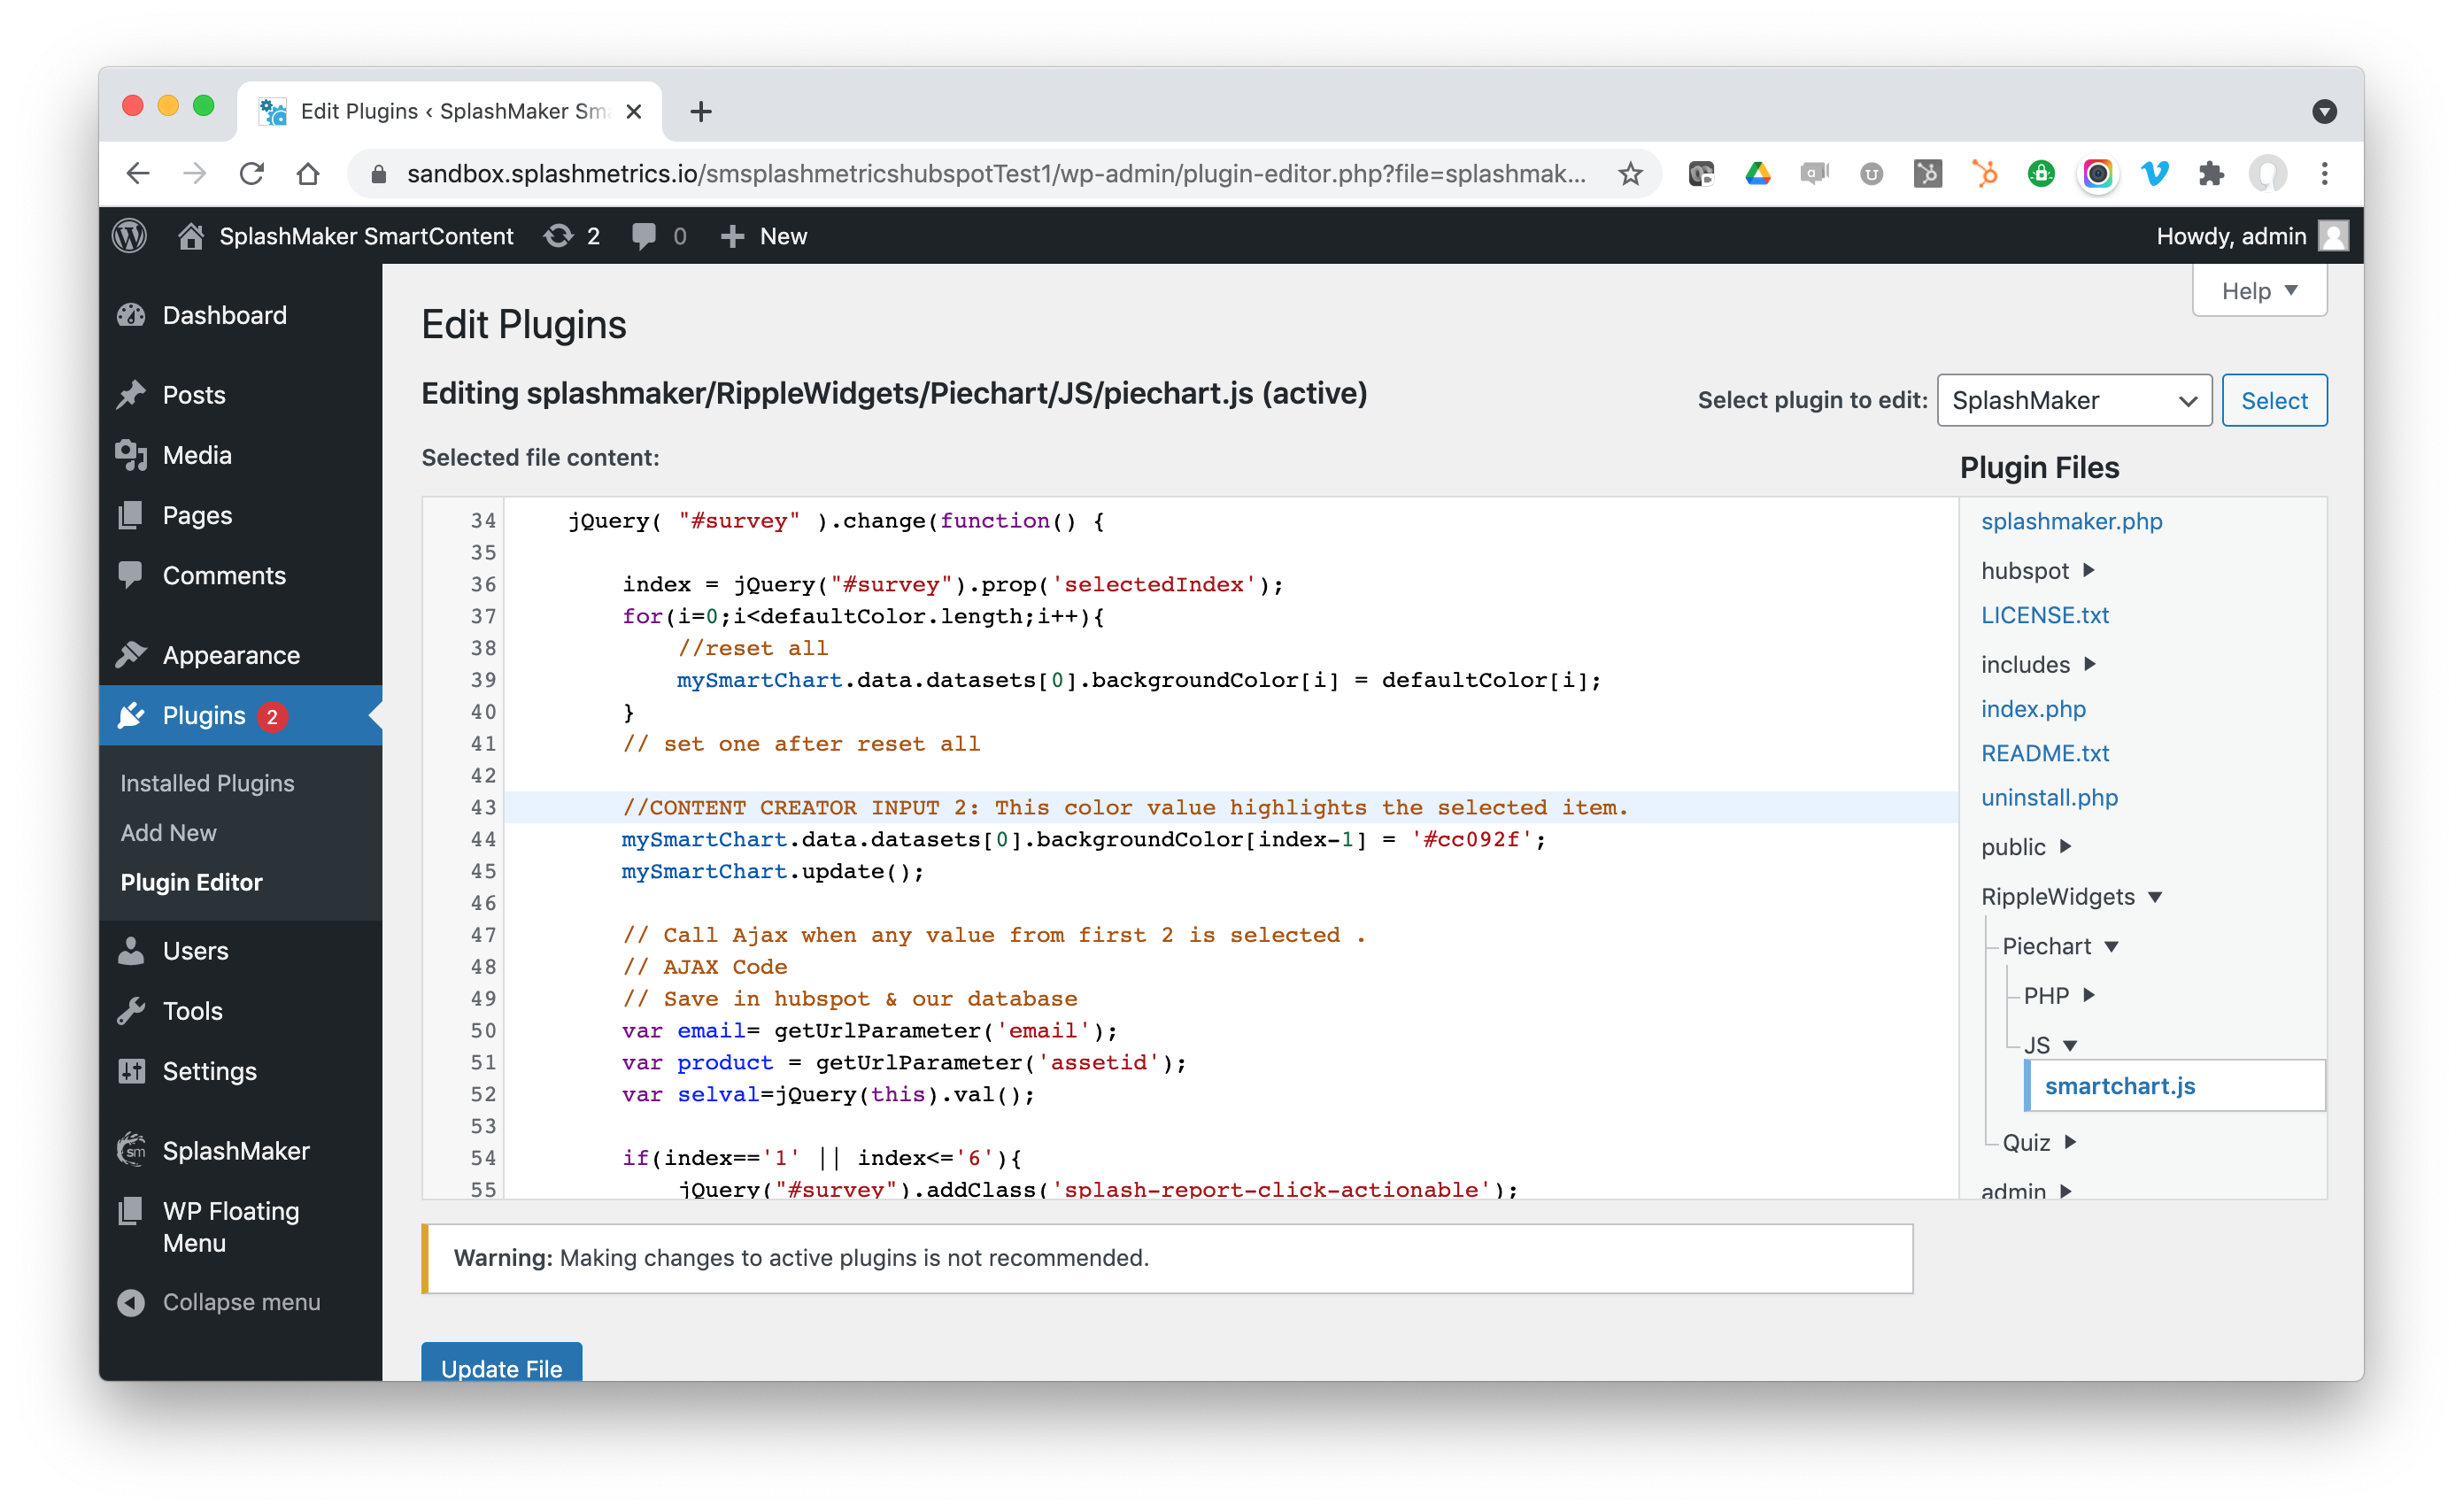
JS Code
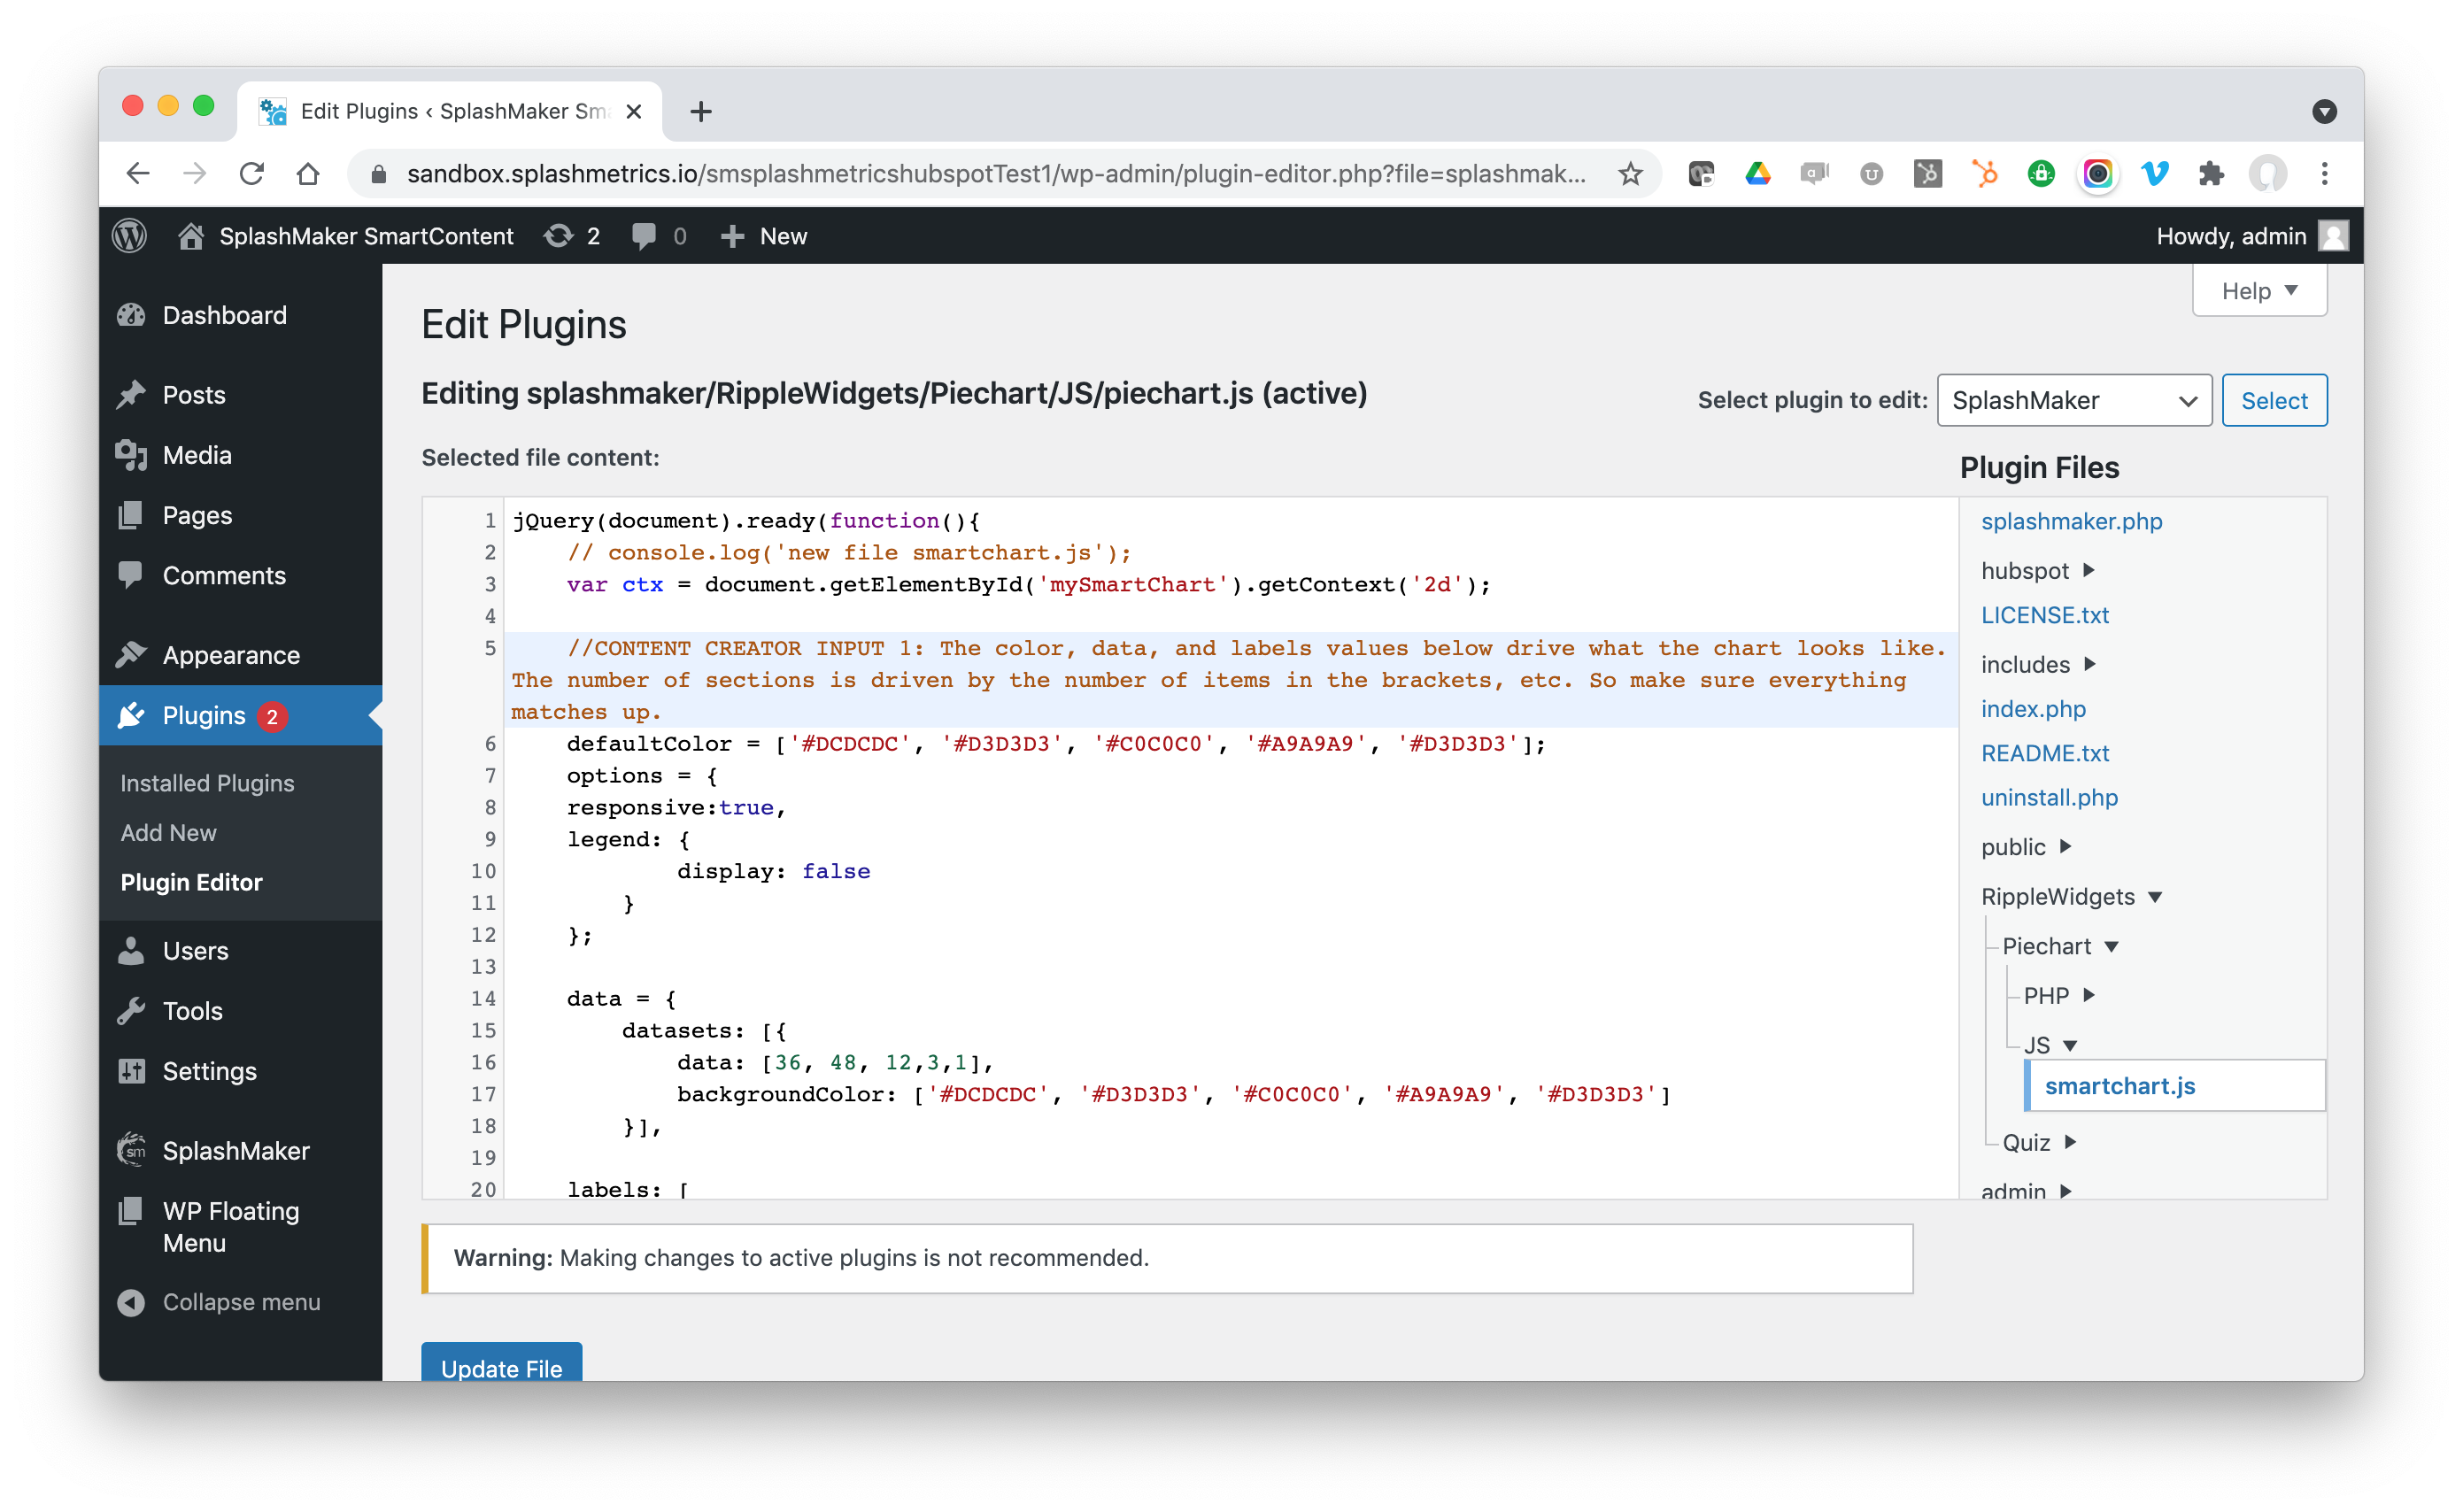
This code works very much the same way, but it specifically controls the appearance and response of the chart to the selection. For example, you’ll see the CONTENT CREATOR INPUT 1 note about driving the colors and number of segments in the chart with the “color” and “data” items above. Just make sure the numbers and order for these items match what you have in the dropdown and you’re good. It’s very straightforward.
In the same way, you can adjust the selected section color here with the CONTENT CREATOR INPUT 2 note…
That’s it! With these few tweaks, you have full control over how the SmartChart works – and how you can leverage the Buyer Data from these interactions in your MA/CRM platform when using SplashMaker+.