
How Can We Help?
How do I “analyze the analytics”?
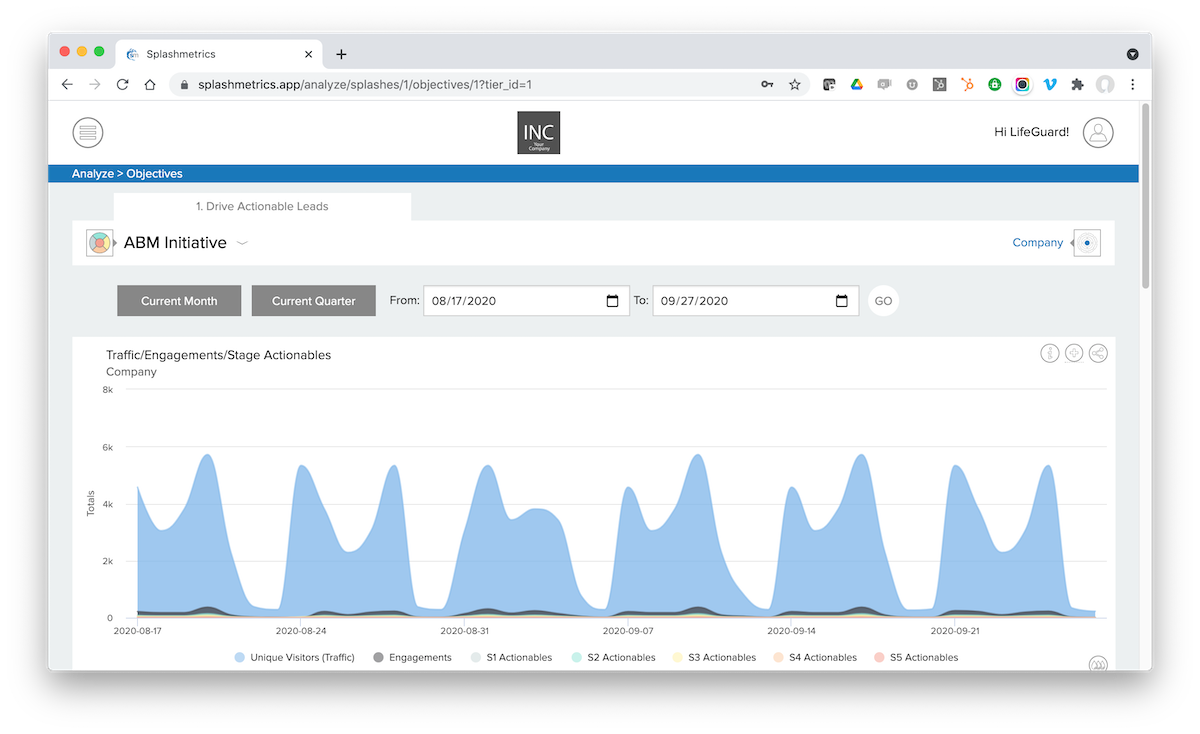
Everything you see in the Drops is tied back to and contextualized by the Splash plan you created.
So, for example, let say you’ve had your Splash running for a week or two and you’re not seeing the results you were hoping for. How do you find what the problems are, where exactly they’re occurring, and how to fix them?
This is where the array of Splashmetrics’ standard Drops come into play – along with referencing back to the Splash plan itself. Let’s take a look at one scenario that might be causing issues and how to quickly identify and fix it.
Not Enough Actionables
This is probably one of the most common occurrences. You’ve spent all this time planning the initiative, building the content, etc. – and you’re not getting the number of qualified Buyers you’d hoped for.
Well, as you might imagine, this particular datapoint is affected by a lot of things such as:
- The amount of traffic you’re driving
- The correct targeting of that traffic ( Is it the right audience?)
- The amount of interaction/engagement that traffic is having with your smart content (the Buyers’ level of interest in the product/content)
- The accuracy of the Actionables you’ve defined in the content in relation to your audience (Are you flagging the right interactions?)
- The motivation of these Buyers to learn more
So, the very first thing to do is open a new tab and pull up the Splash plan. Let’s take a look at the numbers in the plan and see where you might be falling short. For example, let’s start with the Journey Stages, Settings, & Schedule section…
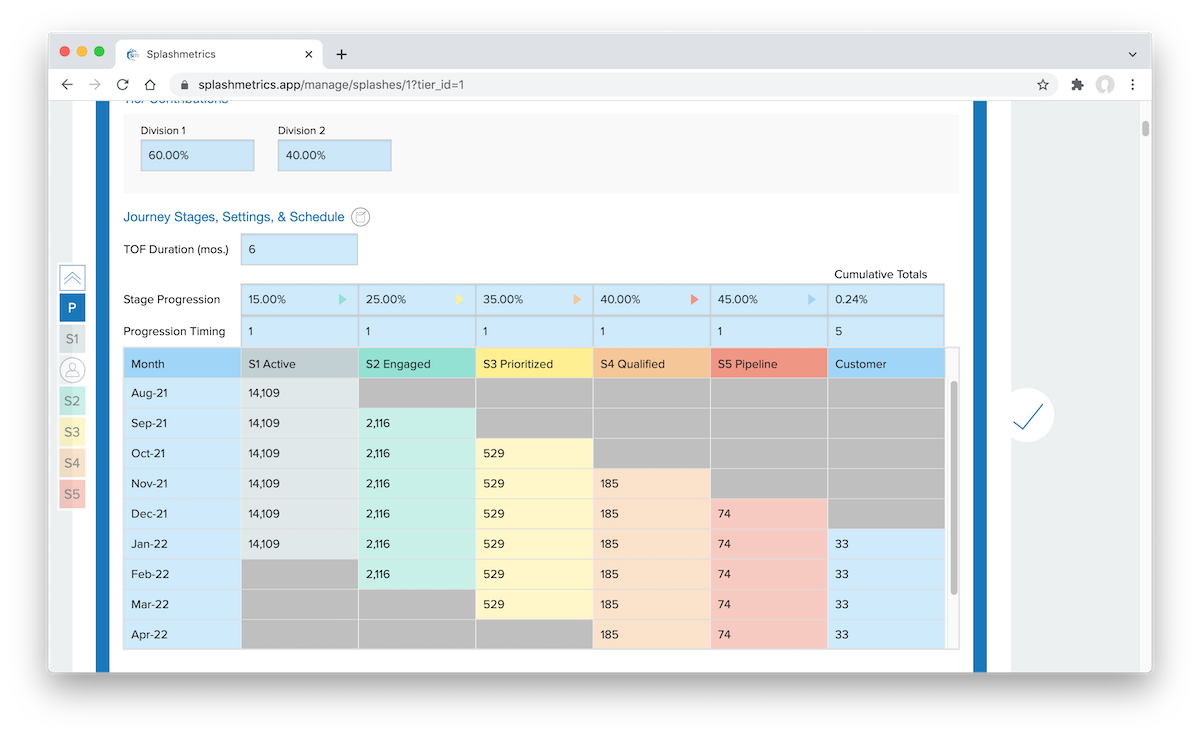
First, are you achieving the required monthly number of entries into Stage 1 of the Flow? In other words, above you see that you need to be hitting a little over 14K unique visitors per month to stage 1 to reach your downstream targets. You can quickly see if you’re hitting that number by doing the following…
Go to Analyze > Flow view in Splashmetrics and set your timeline to 1 month. Then, in the Buyer Actions Per Stage Drop, hover over the blue Unique Visitors (Traffic) item as shown…
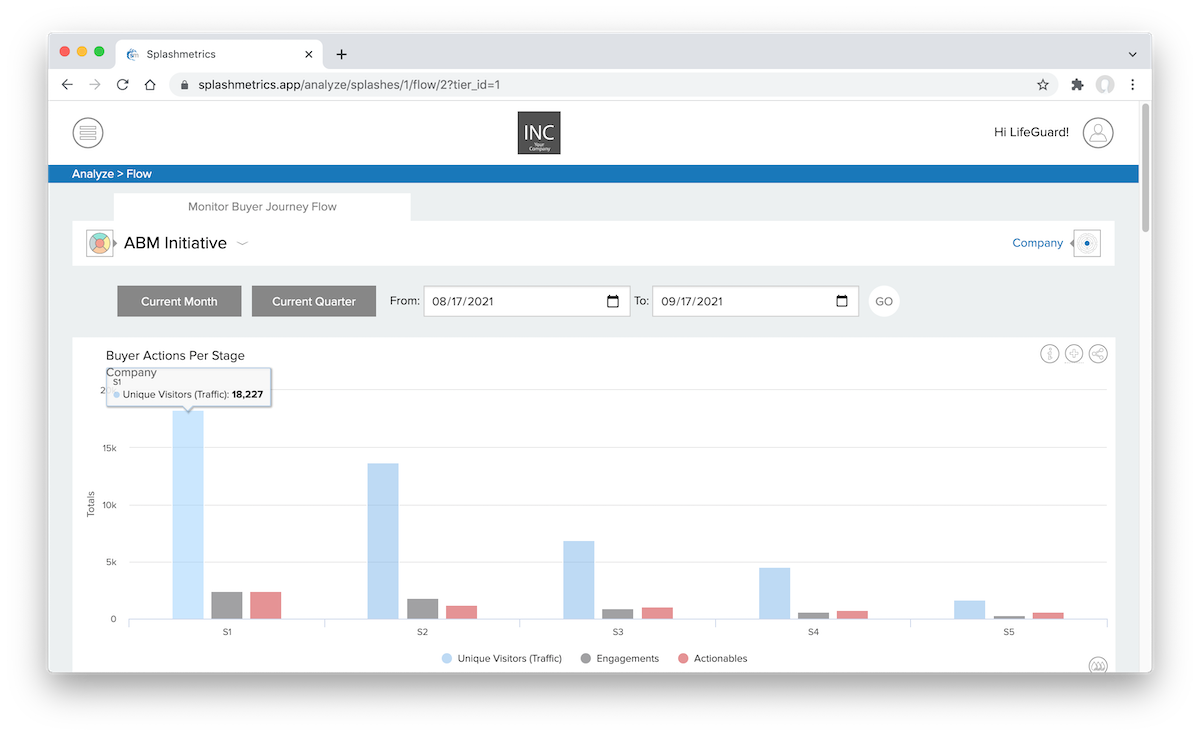
As you can see above, we are showing over 18K visitors to Stage 1 for the selected month, which is well above our 14k target. So we’re doing well there.
Note that the above plan and analytics views are both set to the Company level. If yours is an enterprise company with multiple divisions and departments, use the Tier picker to set both views to whatever division/department you want to evaluate. This will allow precise measurement and evaluation across ever part of the company.
Now that we know we are driving enough traffic to the Journey, let’s take a look at the Stage Progression numbers to see if we are moving enough of these interested Buyers from Stage 1 to Stage 2. You can see that percentage at the top of the Stage 1 column (15%)…
Remember, you can set these percentages yourself when planning your Splash. What you see in the actual analytics will then help you determine future percentages for these progressions based on your own specific audience.
Now, go back to the same Flow view, find the Journey Flow Efficacy Drop, and highlight the green Progressions bar as shown…
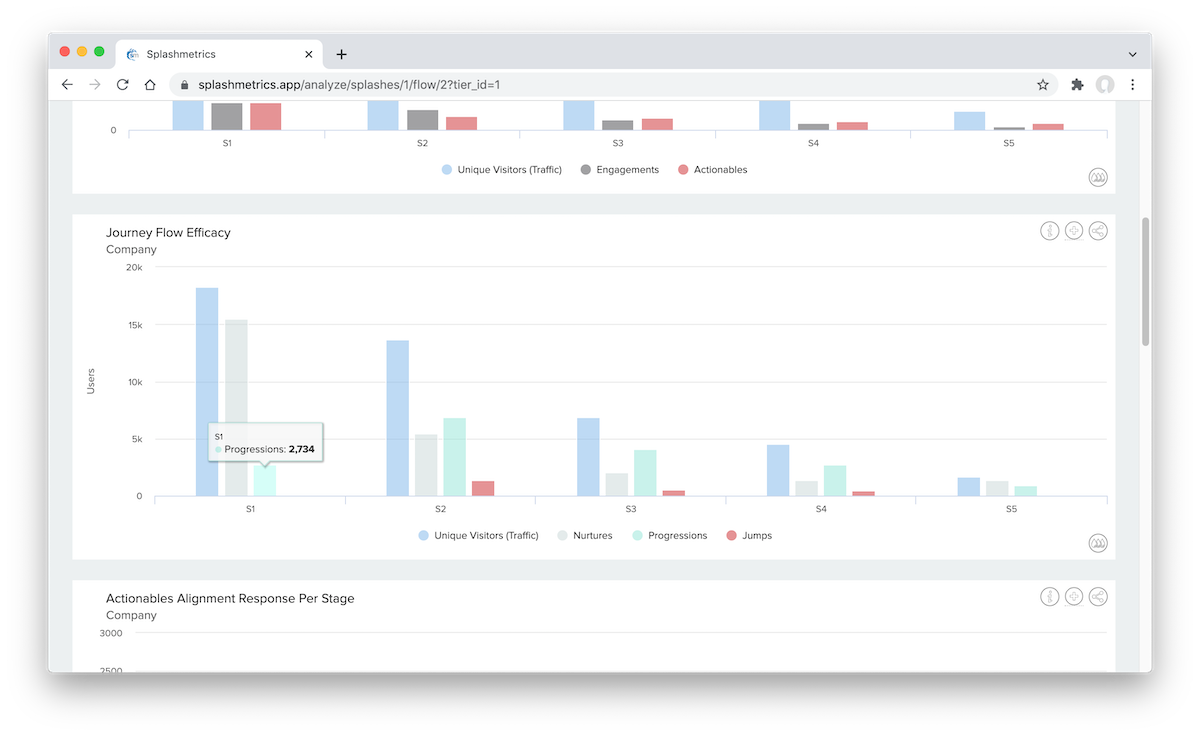
In the Splash plan, we are looking to move 15% of these Stage 1 Buyers into Stage 2. And you can see in the above Drop that we are at about that ratio for Stage 1 when comparing this number to the Unique Visitors (Traffic) number.
So we are moving the right number of Buyers through to Stage 2 for this particular month. But then we need to evaluate whether the Engagements and Actionables from this audience is what we want as they get to Stage 2.
Now, though there are no specific benchmarks for these items in Splashmetrics (since they are dependent on what you define in your content), you obviously want both of these to be as high as possible within the overall traffic.
So let’s go back to the Flow view and look at that Buyer Actions Per Stage Drop again…
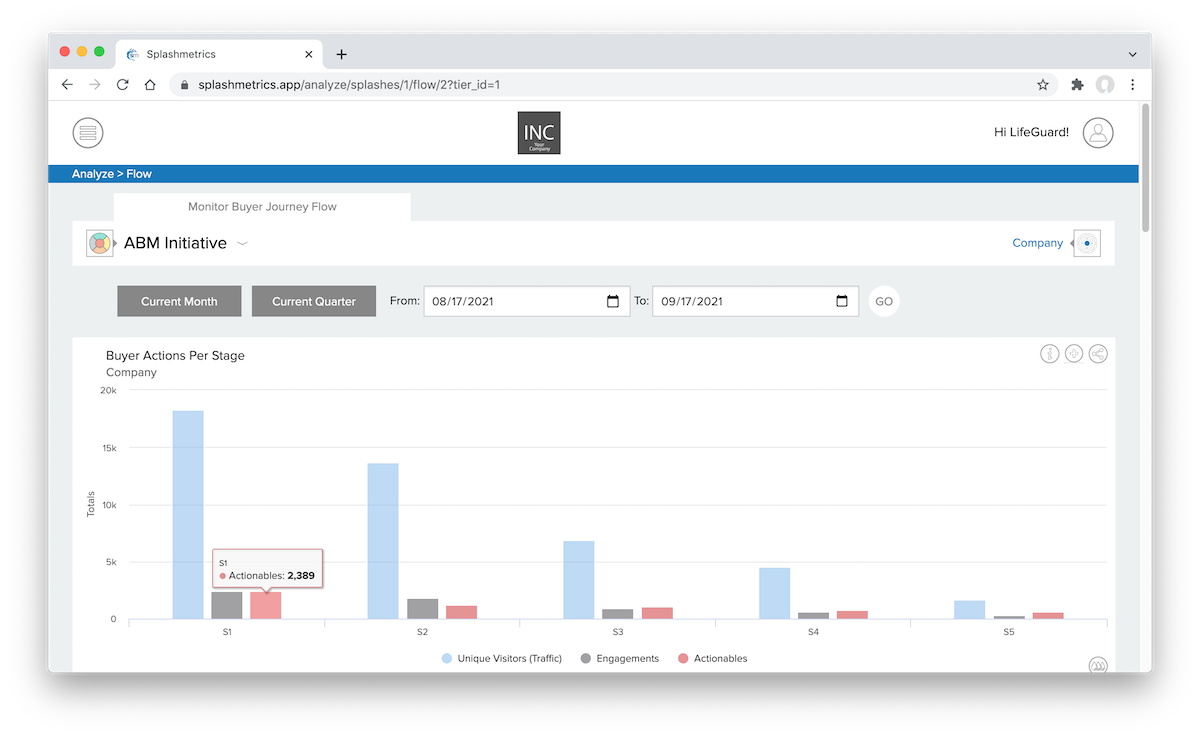
Ideally most of your visitors are interacting/engaging with your content. And then from those interactions, a nice portion of that audience is fitting into the Actionable qualification you’ve defined.
As you can see above, the Engagement number in Stage 1 might be a little low for the number of Unique Visitors coming into this content. You always want as much Engagement with the content as you can get. So you might look at why that is and make adjustments accordingly.
However, the Actionable numbers are strong…with the Actionables number almost matching the Engagement numbers. This means our content is doing a great job of qualifying these engaged Buyers for sales.
So Stage 1 looks great in this regard. But Stage 2 looks a little slower. Why is that? Well, it could be that we are not targeting the right audiences in the right ways for that Stage 2 content. Let’s look at what Channels are being used to pull Buyers into that Stage 2 content.
Find the Journey Flow Channels By Stage Drop…
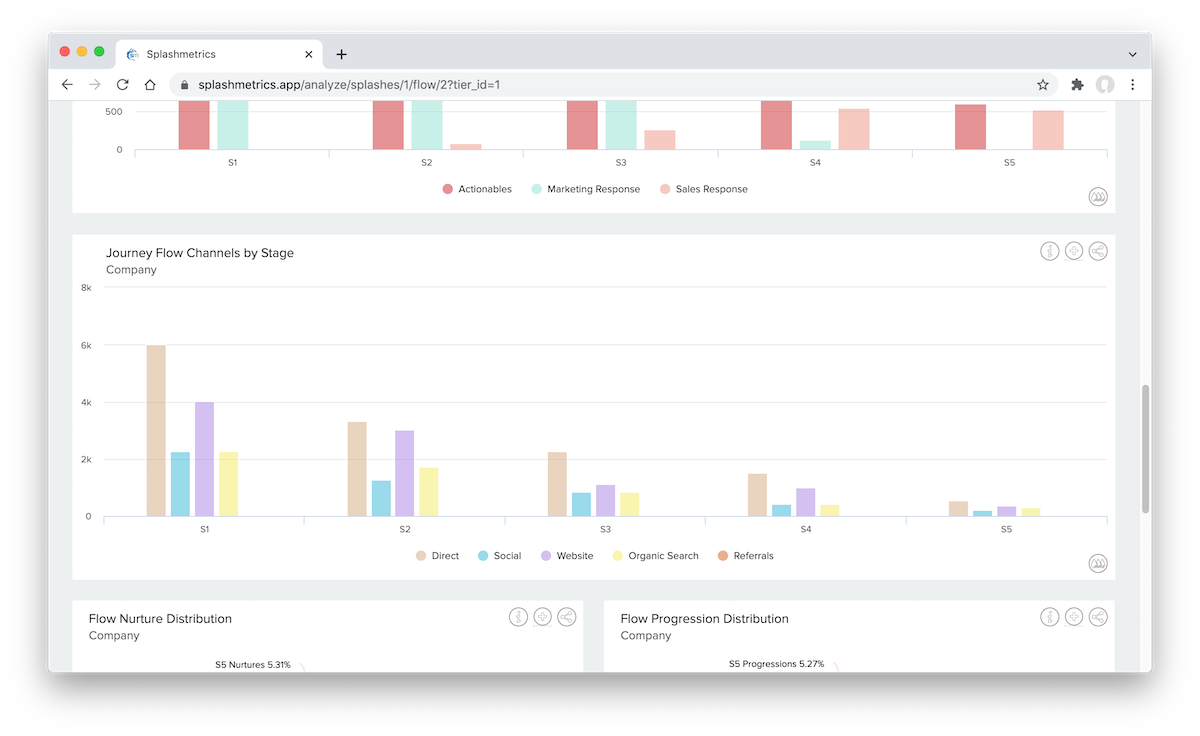
Now bear in mind that Stage 2 is for engaged and/or known Buyers (Buyers for whom we already have the profiling information). So this channel should mostly be Direct traffic (targeted emails, links from existing Splash content, etc.). The traffic here (and especially in the following stages) should not typically be geared toward a more general audience via social media, search, etc. But we’re showing quite a bit of traffic from our website, for example.
So, it could well be that we’re pulling Buyers from our website into these later stages that are not yet ready for this deeper, more targeted content. Instead, that CTA on the website should be linking them to the Stage 1 content asset to introduce them to the Journey. And we should be focusing on email and other means of direct contact (via Marketing Automation) with our known Buyers to correctly target them for these later stages.
Also, since this is a very targeted asset in Stage 2 (not for a broad audience), you also might not want to have it indexable by search engines so you can better control who is getting to this asset and when.
There are many things to consider and perfect. But this is how you analyze what you are seeing in the Journey Flow and Content – and can then take informed actions to maximize the Engagements and Actionables of that content in each stage with the precise audience you built it for.
So, in this case, you might notify your web team and content creators to make these tweaks for the later stage content and quickly optimize for success.
Conclusion
This is just one example, but it shows how you can use the analytics in the Drops, aligning them with the KPIs and Benchmarks in your Splash plan to quickly and easily see what’s working and what’s not in every stage and every asset across the initiative. Then take quick action as necessary – measuring the impact of those changes month-over-month.